
With less than a month to go this year, momentum in U.S. corporate bond issuance continues. High-yield in particular is worth paying attention to.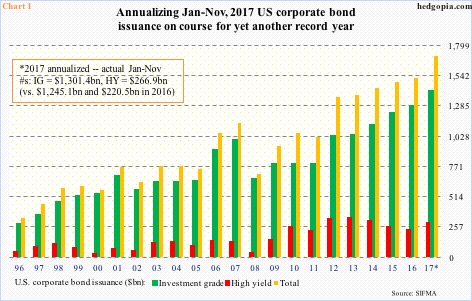
November saw issuance of $125.3 billion, made up of $97.2 billion in investment-grade and $28.1 billion in high-yield.
Year-to-November, issuance totaled $1.57 trillion, comprised of $1.3 trillion in investment-grade and $266.9 billion in high-yield. This compares with $1.47 trillion, $1.25 trillion and $220.5 billion, in that order.
Annualizing the first 11 months, 2017 is on track for $1.71 trillion – another record year (Chart 1). When it is all said and done, the final tally may not be that high, as December last year saw issuance of only $61.3 billion. In any case, last year’s total of $1.52 trillion has already been surpassed.
High yield in particular is of note this year. After three consecutive yearly decline, issuance this year sprung back to life. Last year, energy was adversely impacted due to the drop in oil price. At the current rate, high-yield this year is on track for $291.2 billion – a three-year high.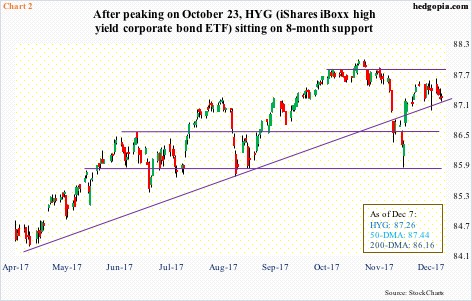
More important perhaps is continued investor fascination with high-yield this late in the economic cycle. The U.S. economy is in its ninth year of recovery. In 2009-2016, high-yield issuance already totaled $2.1 trillion.
From this perspective, the Fed succeeded. One of the primary goals of quantitative easing (QE) and the zero-bound interest rate was to push investors onto/up the risk curve. They have obliged.
Since bottoming at 33.82 in November 2008, HYG (iShares iBoxx high yield corporate bond ETF) rallied 160 percent through the all-time high of 88 on October 23 this year.
Of late, HYG has come under slight pressure. Too soon to say if demand for these bonds is waning. The ETF (87.26) is still comfortably above the 200-day moving average (86.16), although it is slightly below the 50-day (87.44).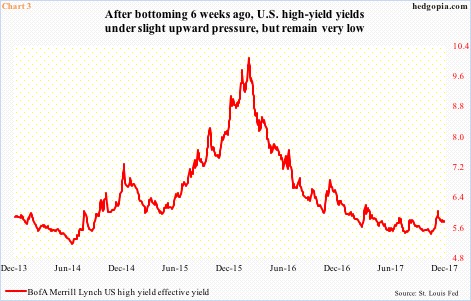
Since the financial crisis ended, junk bonds got bid up as the economy began to recover. Yields persistently came under pressure (Chart 3).
In recent quarters in particular, U.S. economic data have been coming in strong. Real GDP expanded 3.3 percent in 3Q07 and 3.1 percent in the quarter before that. The ISM manufacturing index in November dropped five-tenths of a point month-over-month to 58.2, but September’s 60.8 was the highest since 61.4 in May 2004. But it is difficult to maintain the current momentum.
If cyclical forces exert control, a deceleration is only natural. In this scenario, yields – or spreads – can rise. Ditto with defaults.
Viewed this way – or weighing risk-reward tradeoff – HYG’s path of least resistance medium- to long-term is probably down. Particularly so if the new tax code tinkers with interest-rate deductibility of junk-bond issuing companies.
Thanks for reading!
