Tech’s role in this market needs no elaboration. Information technology makes up just north of 22 percent in the S&P 500 large cap index. Health care is second at 14 percent and financials under 13 percent. In this sense, ‘as goes tech, so goes the broader market’ is not an exaggeration.
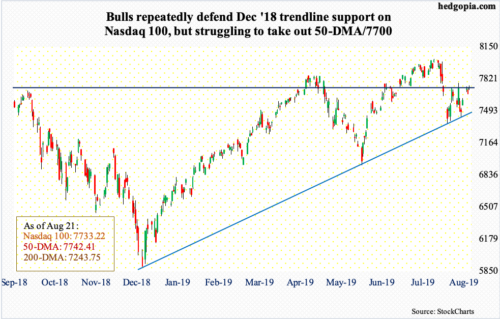
After the Nasdaq 100 Index (7733.22) peaked at 8027.18 on July 26, it quickly shed 8.4 percent in the next six sessions. Selling stopped at important support. Bulls stepped up to defend a rising trend line from last December (chart above). That trend line has been defended two more times since then, including mid-August.
Bulls can take heart from the fact that the 200-day moving average is still rising. On the daily, the MACD just completed a potentially bullish crossover. However, volume is lacking. It is possible traders are waiting to see if the 50-day gets recaptured. In all three sessions this week, sellers showed up at that average (7742.41), with a long-legged doji just under it on both Monday and Wednesday. This level also coincides with one-year horizontal resistance at 7700. Hence its significance.
It is not uncommon for the Nasdaq 100 – or any other index, for that matter – to hesitate around resistance of this significance, particularly so considering it already rallied five-plus percent from the August 5th low. With that said, this level is worth watching. From bulls’ perspective, the sooner this ceiling is broken through, the better. In the event the resistance holds firm and the index comes under renewed pressure, that trend line gets tested around 7500.
Thanks for reading!

