 Less than two weeks ago, when the S&P 500 Large Cap Index was giving out signs of fatigue, the VIX was giving out signs of stability. The former went on to post a new all-time high early this month, even as the latter refused to make lower lows. The VIX never took out the post-financial crisis low of 10.38 recorded early July. There is an interest among market participants in buying protection. We have known for a while that traders have been avoiding former momentum favorites. Small-caps have been lagging since early March when they first peaked; late June, they revisited those highs, but were gasping for air by the time they got there. They have lost their momentum mojo, with monthly indicators having already flashed a sell signal. In some ways, this is understandable. The Fed and its QE programs have been instrumental in sustaining the rally in equities that is now in its sixth year. By October, they would have completely tapered the QE 3.0 currently in progress. In the past, an end to QE has dealt a blow to equities.
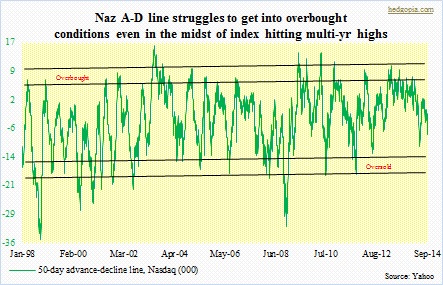 Despite that history, stocks so far have held up pretty well. Even more so considering that the market seems to be expecting a Fed hike in interest rates earlier than previously expected. It is a double whammy. Come to think of it. Not only will the Fed stop printing money but will also raise the cost of money sooner. Stocks are undeterred. While this suggests a high level of underlying conviction among market participants, some internals point otherwise. This is particularly so among Nasdaq stocks. For a while now, one consistent theme on this blog has been the weakness in Nasdaq internals. This is despite the fact that the index just hit multi-year highs. And this is not something recent, rather has been going on particularly since the beginning of the year. As can be seen in the adjacent chart, the Nasdaq advance-decline line has been consistently narrowing. To be clear, there are no hard and fast rules on this. Back in May, when equities were in the process of forming a bottom, the A-D line never got to oversold conditions. If one waited for that to come to pass, one would have missed the subsequent 15-percent-plus rally. But the metric definitely helps us get a read on near-term sentiment as to which way things might be headed.
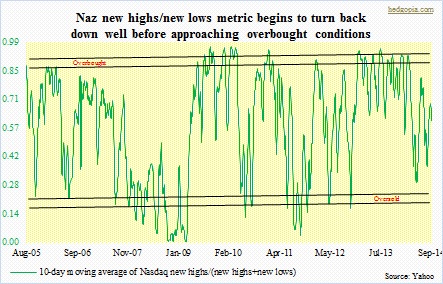
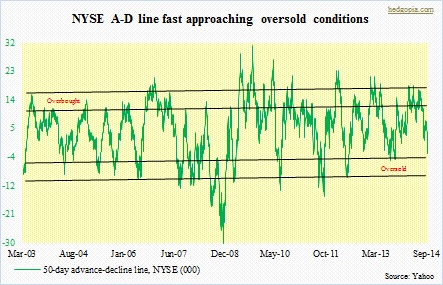
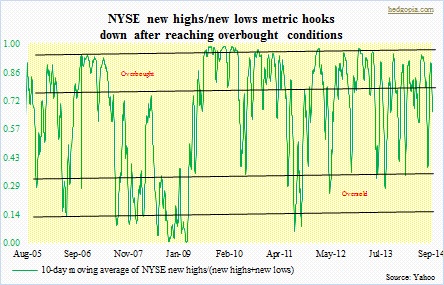 What are they saying now? The Nasdaq just passed the middle of the range, and the momentum is to the downside. Interestingly, on the NYSE the A-D line (first chart on top) is not that far away from reaching oversold levels. The index is sitting right underneath its 50-day average. So the fate of the line (A-D) probably depends on whether or not there is a convincing breach of that average, which by the way is no longer rising. Looking at the accompanying chart, odds seem decent that the path of least resistance on the NYSE (10909.31) is down. Most recently, the new highs/new lows metric peaked early this month, and it seems to want to go lower; if the downward momentum picks up, there is a ways to go. Over on the Nasdaq (4518.90), the same metric (below), once again, has hooked down without getting to overbought levels. As is the case with the A-D line, this has been going on for a while. The index is advancing, but participation is narrow, and getting narrower. There is a new-found love for large-caps, with heavyweights like MSFT, AAPL and INTC doing all the heavy work. If history is any indication, narrow participation does not ensure longevity.