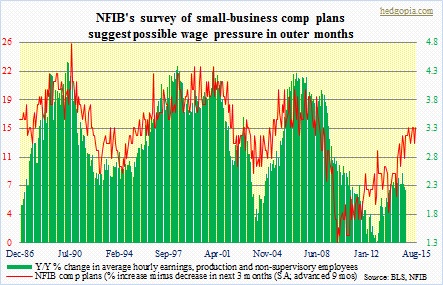
Not to beat a dead horse, but the current U.S. recovery falls short in many ways. One of which is wages. Six years into the recovery, the share of national income continues to tilt heavily toward corporations. Labor’s is just trading water. Annual change in the average hourly earnings of production and non-supervisory employees has been flattish in the two-percent range. Real earnings are flat since the Great Depression ended.
Despite this, we continue to hear how the labor market is tightening and how it is just a matter of time before wages came under upward pressure. Hope springs eternal. Nonetheless, if we are to believe the National Federation of Independent Business survey, wages are set to rise next year. In the chart, small business owners’ compensation plans is advanced by nine months and plotted against actual hourly earnings. And going back nearly 30 years, the former has shown a tendency to lead. Let us hope that happens. Although it must be pointed out that it has been a year since these business owners have been planning for higher comp.


dick1931
Some of the lack of hourly wage progress in the past couple of decades may be due to some of the excesses of wages during the dotcom boom. In decades prior to that high wages of the steel, auto and highly unionized industries was being phased out from both cost cutting and retirements.
A large portion of the highly paid labor force has retired and been replaced by younger workers may be accustomed to a lower standard of living.
The greater share of income taken by the corporations is another issue.
I would like to see a breakdown of income among corporate sectors.
What would really be interesting to see the amounts and trends of corporate campaign contributions by corporate sectors (finance, oil, pharma, etc) and how that relates to corporate ROE, growth, etc. “opensecrets.com” has the data by two year election cycles.
If you get around to doing this, I could give you some background.
You come up with some very interesting insights.