
- Technically strong dollar bumping against two-decade-long resistance
- Trend-following hedge funds’ net longs in dollar index futures highest ever
- To watch out for: rise in odds of no rate hikes in U.S. and ECB QE disappointment
Not a single day goes by when someone comes on TV and declares that the U.S. dollar goes higher. Reasons cited vary from favorable interest-rate differential to comparatively better economic data to QE-induced reversal of carry trade to plain-old ‘momentum begets momentum’. All valid points, and have been so for a while. One only needs to look at how the U.S. Dollar Index has performed. Since July last year, it is up nearly 16 percent (92.46)!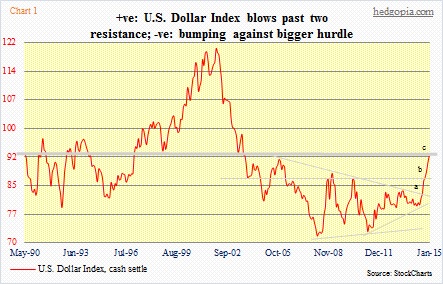
Chart 1 captures that move nicely. The word parabolic is what comes to mind looking at the right side of that chart the past eight months. It is a monthly chart. In a weekly chart (not shown here), the index is up in 23 of the last 28 weeks (including this week). On all time intervals, technicals are way overbought. On a monthly chart, the last time the RSI was as oversold was back in October 2000. The index peaked in July 2001 back then, before proceeding to decline for multiple years.
One of the reasons the dollar has performed so well is technical in nature. In September last year, the index took out a nine-year-old resistance (‘a’ in Chart 1). That took care of stops as well as drew more buyers in. Soon after, another resistance fell (‘b’). Now comes the grand test. Resistance represented by the thick grey line (‘c’) goes back not years but a couple of decades.
This is a level to watch closely.
As strong as the dollar has been, it needs a catalyst for a reversal. This is true with any asset class. And anytime a strong performer is bumping against as strong a resistance as this one, people start looking for a reason. There are times they begin to overanalyze.
Should Jeff Gundlach be right about the 10-year Treasury testing the 1.38-percent low, then the dollar can only be expected to attract more bids as overseas money comes in in search of safety in both the dollar and long bonds. But right here and now, one of the main reasons for dollar strength is expectations for a rate hike mid-year. This blog has consistently maintained that there is not going to a hike this year. But this is one person’s opinion, which the market disagrees with.
In recent weeks, though, we are beginning to hear commentators talk about the need to push out rate hikes. Even some FOMC members, including Chicago Fed President Charles Evans, a voting member, who the other day opined that the Fed should wait until 2016 to raise interest rates.
The more such sentiment begins to get traction, the higher the odds that the interest-rate differential argument goes out the window.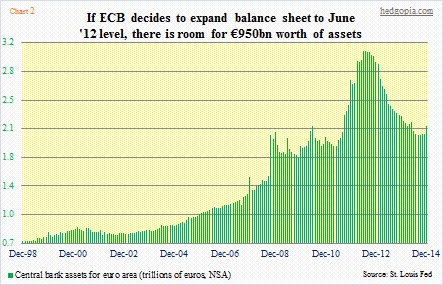
Particularly if the ECB disappoints when they meet on the 22nd. What are the odds of that happening? The way it is looking now, a plain-vanilla QE is probably priced in in the Eurozone. If Mario Draghi, ECB president, can/does not deliver, then it is a no-brainer. The euro rallies. If there is QE, then it is a question of how much. I read somewhere this week that the ECB wants to do €500bn. Markets probably want more. The ECB deciding to bring its assets to the mid-2012 level of €3.1 alone guarantees nearly a €1tn (Chart 2).
Hence for the euro to go lower still, Draghi has to be able to shock and awe the market the way Haruhiko Kuroda, BoJ governor, did late October last year, immediately resulting in a lower yen and higher stocks.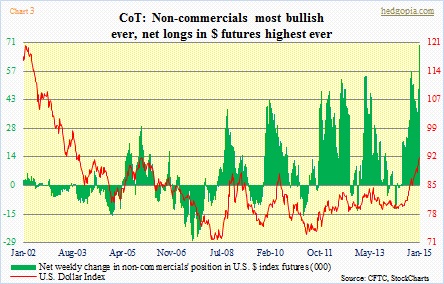
Absent of such magic by Draghi, traders will be eyeing for signals if it is time to cash in on their long dollars and short euros. Just look at Chart 3. Non-commercials’ net longs in U.S. Dollar Index futures are the highest ever. That is how one-sided this trade has gotten. Hence the significance of that resistance in Chart 1 (‘c’).
