
- Long-term, S&P 500 index still within six-year trend channel
- November-2012 trendline broken late September in midst of recent decline
- Possible test of that broken trendline potentially ideal place for shorts to build positions
In the big scheme of things, despite the near-10-percent decline in the past month, the S&P 500 Large Cap Index is still trapped in a well-defined six-year trendline. That is the good thing. The September peak was right on cue, as the index got repelled at the top end of the range. Here is the bad, though. Selling was so pervasive in the subsequent decline that a shorter trendline – the one beginning in late 2012 – could not be saved. It was broken late September, which preceded a decline all the way up to 1821 last week. More often than not, it is normal to test such breakdowns. If that were to happen, that could occur around 1980. If that test is unsuccessful – base case on this blog – technicians would bill it as a negative development. A lower high signals waning momentum. A lower low is already in place. Here is why this is important. 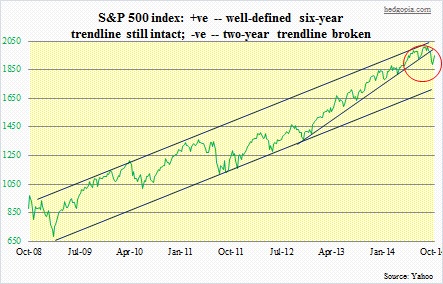
The recent decline in large-caps was preceded by weakness in small-caps. The Russell 2000 Small Cap Index first peaked in March this year. The subsequent 10-week, 11-percent correction took out late-2012 trendline, similar to what the S&P 500 recently experienced. Four months after the first peak, the Russell 2000 goes and retests the underside of that broken trendline. And fails (red circle in chart below). Big time. The result was a three-and-a-half-month, 14-percent rout. There was a similar development on the Dow Industrials late July when it could not hold on to that November-2012 trendline (not shown here). A subsequent retest of that trendline mid-September failed. 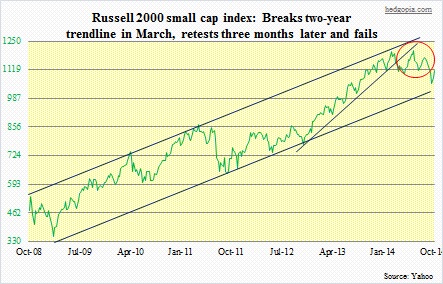
The suggestion here is not that a similar fate awaits the S&P 500 (1951). First, 30 more points are needed before potential becomes reality. Secondly, this week’s move has been strong. The index needed to close above 1900 this week, and that will happen. It has retaken its 200-day moving average. However, the 50-day lies right above. And the rally yesterday was rejected at the 100-day. If the index manages to jump over both these hurdles, that broken trendline resistance will be in play. Ideally, it is a perfect place to start building shorts.
