
The sell side is on the move.
We just got the first taste of how bottom-up analysts view the recently passed tax cuts will impact corporate earnings.
Last Friday, operating earnings estimates for S&P 500 companies were revised higher by $3.25 to $149.05 (Chart 1). Similarly, S&P 400 and 600 estimates went up by $3.04 to $100.99 and by $1.03 to $47.14, respectively (not shown here).
The Tax Cuts and Jobs Act of 2017 was signed into law on December 22. Estimates for S&P 500 companies bottomed in the middle of November, and particularly began to rise once the tax bill became law.
The spike in the right-most bar in Chart 1 cannot go unnoticed. These analysts customarily tend to remain optimistic at the beginning of a year. In all probability, we have not seen the last of upward revision for 2018. In fact, last Friday, 2019 estimates also were revised up $4.54 to $164.57.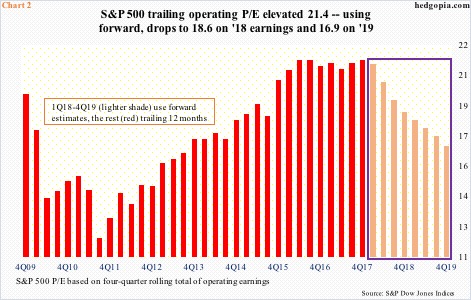
This matters.
For valuation purposes, the majority use forward earnings, which ordinarily is the right thing to do. But we are also in an environment in which estimates start out rosy and then get revised lower as time passes. Estimates for 2017, for instance, were $141.11 in January 2016; if 4Q comes in as expected, earnings are on track for $125.
The latest upward revision for 2018 obviously puts downward pressure on the price/earnings ratio. On a four-quarter rolling total basis, the S&P 500 large cap index trades at an elevated 21-plus. Using forward, the metric improves – 18.6x on 2018 earnings and 16.9x on 2019. On an absolute basis, this is still not cheap, but relative to trailing, it looks better.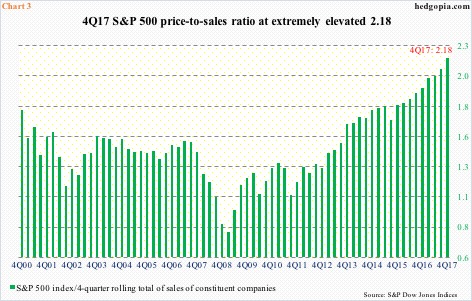
The bigger question is, how would sales fare? Would the tax cuts positively – and sustainably – impact the top line? Which is what is needed for lasting improvement in the bottom line.
Chart 3, which uses a trailing price-to-sales ratio for S&P 500 companies, gives us some perspective. This metric has never been higher.
Using last year’s closing price for the S&P 500, the ratio stood at 2.18, which is what the chart shows. Using Tuesday’s all-time high of 2807.54, it rose to 2.29, and to 2.27 using 2776.42 close. In March 2000, the ratio peaked at 2.25.
These are heady readings, and worth keeping in mind before buying wholesale into the sell side’s tax-related earnings optimism.
Thanks for reading!
