The saga of listless velocity of money continues in the U.S.
The M2 money supply (seasonally adjusted) stood at $11.9 trillion in April, up from $8.4 trillion in June 2009 – an increase of $3.5 trillion. Between 2Q09 and 1Q15, nominal GDP rose from $14.3 trillion to $17.7 trillion – an increase of $3.4 trillion.
While this looks normal on the surface, dig a little deeper, and problems begin to appear.
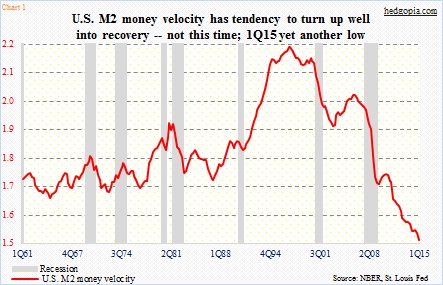
M2 money velocity reached yet another low in the first quarter. At 1.502, it is now lower than when the current recovery began in 3Q09; back then, it was 1.71. Early on during the recovery, velocity quickly gathered steam, as it rose to 1.74 in 3Q10. From that point on, it was all downhill.
Historically, as Chart 1 shows, velocity has tended to trough shortly after the economy turns up. This cycle, nearly six years into expansion, this has yet to happen.
Briefly, velocity is money stock divided into nominal GDP. It is the speed at which a dollar moves from one transaction to another. The higher the number of transactions, the more goods and services are produced. At the current rate of 1.5, each dollar of M2 money is spent only 1.5 times.
M2 includes cash and checking deposits as well as savings deposits, money market mutual funds and other time deposits.
Remember the M . V = P . Q equation?
Where,
M = Money stock
V = Velocity of money
P = Price level
Q = Quantity of goods and services produced
Algebraically then, V = (P)(Q)/M.
So velocity is crucial.
This is no news, but real GDP has averaged sub-par growth in the current recovery – a mere 2.2 percent, versus an average of 3.3 percent going back to 2Q47. But at the same time, for velocity to be as weak as it is, has money supply been growing at too rapid a pace?
Simplistically, assuming velocity stood at pre-Great Recession level of two, nominal GDP would be just under $24 trillion. Which is not even remotely realistic.
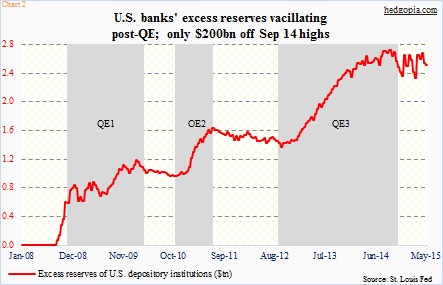
One big factor causing the rise in M is QE. Right before QE1 began in November 2008, the Fed’s SOMA (system open market account) holdings stood at under $500 billion, which since has risen to $4.2 trillion. But not all of this money is finding its way into the system, which, if it did, could have potentially given a boost to both output and inflation. A big chunk is sitting in the form of banks’ excess reserves (Chart 2). This has helped on one hand boost money supply and on the other suppress money velocity.

