
- U.S. corporate profits down in 2014, but not S&P 500 earnings
- Since ’46, corporate profits have only dropped 4 times during expansion
- Twice since 1989, corporate profits fell but not SPX earnings, latter fell following year
U.S. corporate profits were down in 2014. Not a whole lot, but down nonetheless. This does not happen very often – particularly when the economy is still in expansion mode. Is this a signal of some sort? Let us take a look.
Corporate profits before tax [with inventory valuation and capital consumption adjustments (which means it is adjusted for depreciation and the value of inventories)] were $2.09 trillion in 2014, down 0.8 percent from $2.1 trillion the year before. This is the first time since 2008 that profits have shrunk.
First of all, just to be clear, corporations have done exceedingly well in the current cycle. Profits last year were well beyond the prior high of $1.65 trillion in 2006 and up 63 percent since the cycle low of $1.29 trillion in 2008.
However, it is rare for profits to drop during expansion. Chart 1 brings a few interesting tidbits into focus.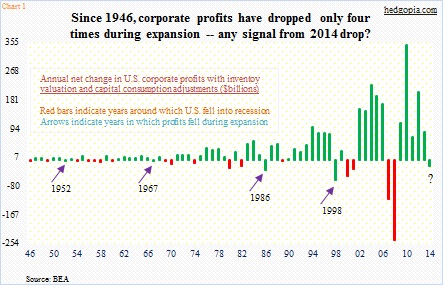
First off, profit shrinkage is not that common. Since 1946, annual profits dropped in 21 years (out of the 69). That is less than a third of the time, which makes sense given economic recoveries are longer than contractions, as are bull versus bear markets.
The chart uses annual change in profits. For instance, they shrank last year by $17.1 billion. The red bars indicate the years – leading to, during or shortly after – around which the U.S. was in recession. The arrows indicate the years in which profits fell but there was no recession; there have only been four such years – 1952, 1967, 1986 and 1998.
Given this rarity, what is the drop last year trying to tell us? That 2014 is one of those four years or like the other 17 (the red bars in Chart 1)?
There is another way to look at this – by comparing overall profits with earnings for S&P 500 companies.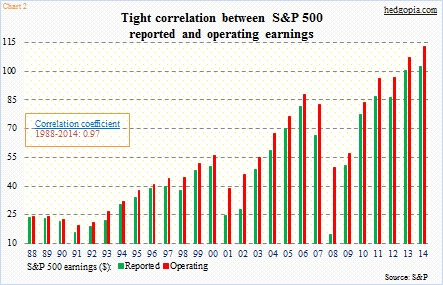
Both operating and reported earnings for S&P 500 companies grew last year – up 5.3 percent and 2.1 percent, in that order. First of all, to our surprise, there is a tight correlation between the two – a near-perfect 0.97, between 1988 and 2014 (Chart 2). We all know how financial engineering has helped lift earnings per share (buybacks, etc.). Nonetheless, reported numbers are not that far behind operating numbers, although the distance between the two has widened a bit since 2007.
For our purposes in Chart 3, we are using operating earnings. The chart plots annual percent change in U.S. corporate profits against operating earnings for S& 500 companies.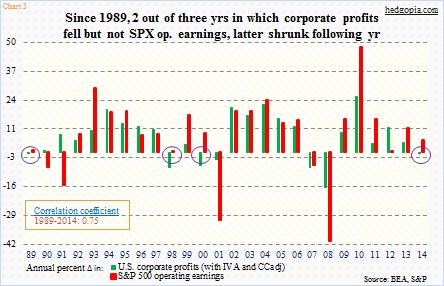
It turns out the two correlate well. R is 0.75 during 1989-2014; it jumps to 0.98 using absolute dollar amounts (not shown here). During the period, there were four years in which the green bars shrunk even as the red ones continued to rise (noted by circles), like what we had last year – 1989, 1998, and 2000. Except for 1998, both 1989 and 2000 were followed by profit shrinkage for S&P 500 companies – 1990 was down 6.9 percent and 2001 was down 30.8 percent. Will 2015 witness a repeat of that?
With one quarter gone, the year has not gotten off to a good start. Operating earnings are expected to be down in the first two quarters, and then come roaring back in the last two; 4Q in particular is expected to surge 20 percent! The usual optimism! But, as shown in both Charts 1 and 3, risks are rising.
