
US stocks have come under immense downward pressure of late. Amidst this came signs late last week that a relief was overdue. Several indicators are languishing in oversold territory, an unwinding of which could unleash upward pressure for stocks.
The downward pressure US equities have come under this year drove small-caps and large-cap tech into bear-market territory, which is popularly defined as being down 20 percent. Large-caps, represented by the S&P 500, was merely one-tenth of a percentage point from meeting this threshold.
Along the way, the large cap index, along with the Nasdaq 100 and the Russell 2000, lost one after another support. All these three indices are in breach of their respective 50- and 200-day moving averages. Several rally attempts have failed.
Amidst this came signs late last week that a relief was around the corner.
At Thursday’s low, the Nasdaq 100 was down 7.9 percent for the week but recovered enough to end the week down 2.4 percent – for a weekly bullish hammer. Importantly, bids showed up at an important juncture.
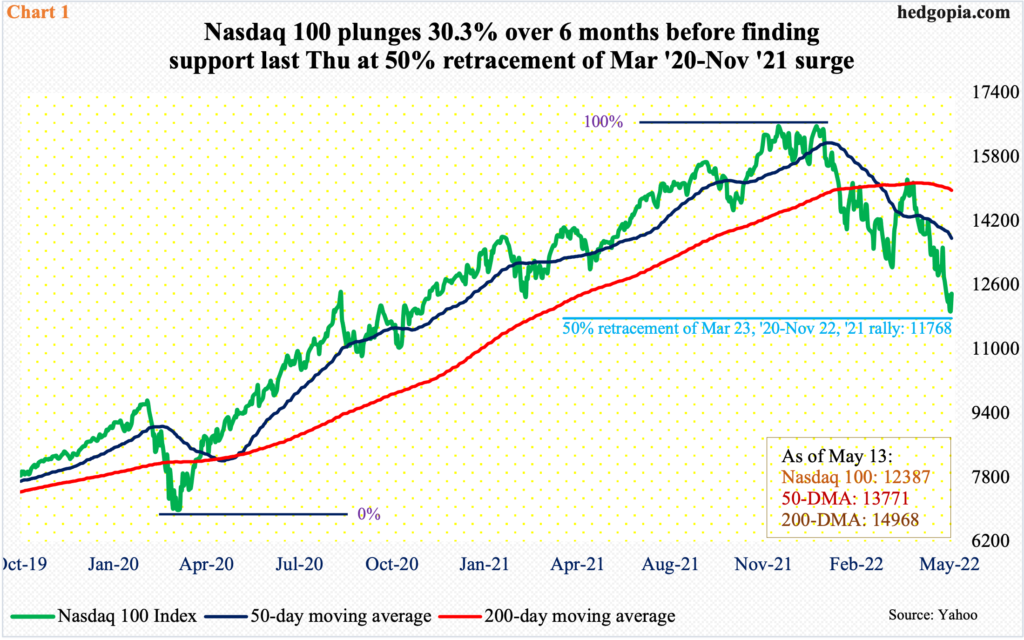
The index peaked last November at 16765. Before that in March 2020, the Nasdaq 100 bottomed at 6772. A 50-percent retracement of this surge lies at 11768 (Chart 1). Thursday’s low was 11692, down 30.3 percent from its high six months ago. The week closed at 12387.
Nearest resistance rests at 13000.
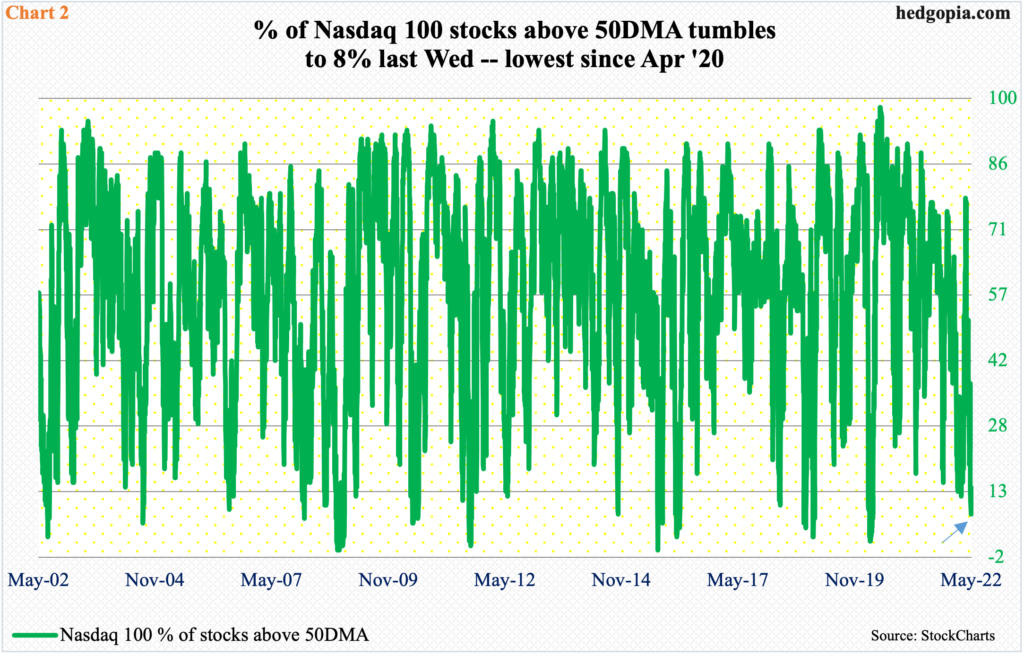
The tech-heavy index has witnessed such relentless distribution that last Wednesday only eight percent of its constituent stocks were above the 50-day (arrow in Chart 2). At the broader Nasdaq Composite, seven percent were (not shown here).
This is out-and-out oversold territory, if not a flush-out. Several times in the past, this metric dropped to the low-single digits before reversing higher. This time around, it is very possible a low was reached last week. By Friday, they respectively rose to 14 percent and 12 percent.
The extremely oversold condition depicted in Chart 2 is not an exception, rather a rule. Investor sentiment similarly remains way suppressed.
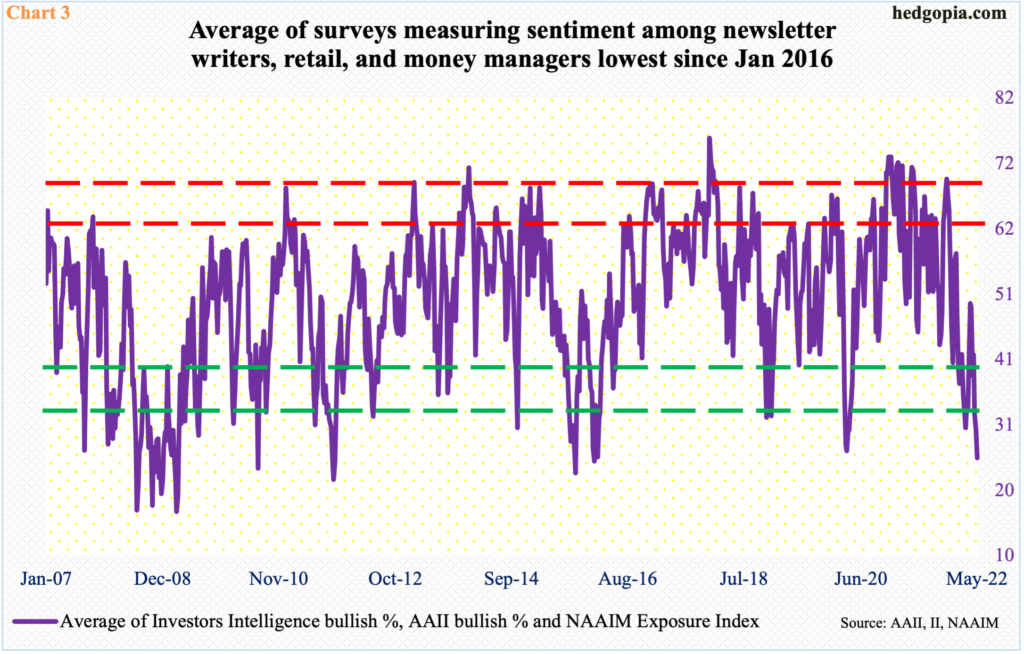
Chart 3 shows an average of Investors Intelligence bullish percent, AAII (American Association of Individual Investors) bullish percent and NAAIM (National Association of Active Investment Managers) Exposure Index. Last week’s 25.4 was the lowest since January 2016.
Individually, Investors Intelligence bulls dropped 3.3 percentage points week-over-week last week to 27.6 percent, which was the lowest since February 2016 and lower than the March 2020 low of 30.1 percent (chart here). This survey polls newsletter writers.
AAII takes a pulse of retail sentiment. Last week’s count was 24.3 percent, down 2.6 percentage points w/w. A month ago, this metric languished at 15.8 percent, which was the lowest reading since September 1992.
Last but not the least, the NAAIM Exposure Index represents members’ average exposure to US equity markets. These are professional money managers. Last week, the index fell 7.4 points w/w to 24.3, which is the lowest since April 2020.
The point is, all these three measures of sentiment are suppressed, an unwinding of which can result in a nice tailwind for equities.
Speaking of which VIX seems to want to go lower for now.
Since January, the volatility index has had several tries at mid- to high-30s – all unsuccessfully. This occurred again last week when it tagged 35.48 on Monday. This was yet another low in a series of lower highs since hitting 38.94 in January. VIX closed last week at 28.87.
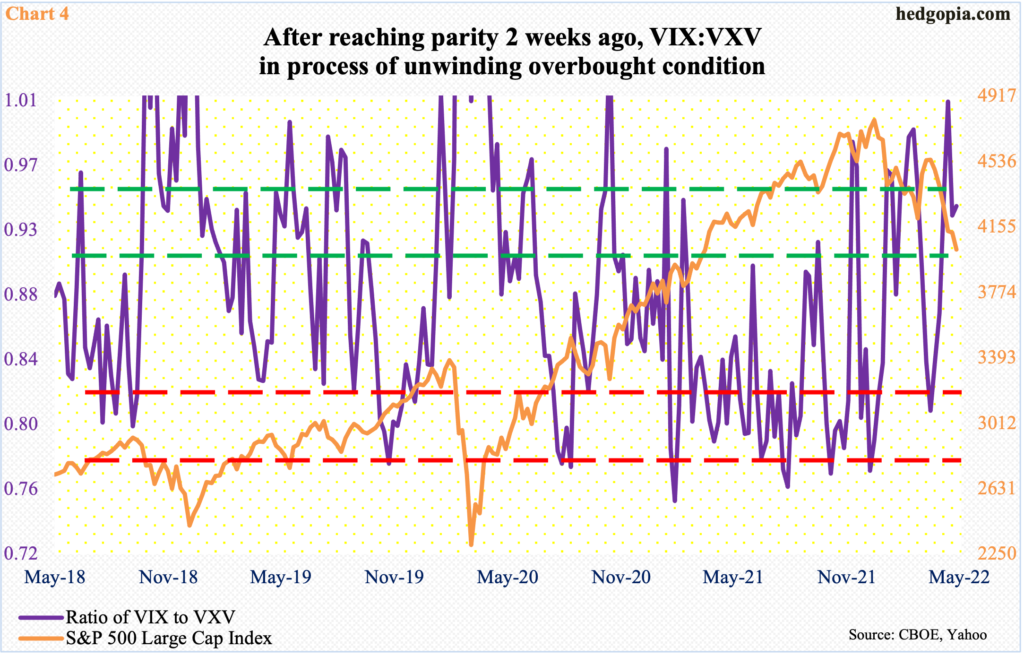
Should investor mood shift to risk-on – duration and magnitude notwithstanding – demand for nearer-term protection should dissipate. In this scenario, the ratio of VIX to VXV heads lower.
VIX measures market’s expectation of 30-day volatility on the S&P 500. VXV does the same, except it goes out to three months. When investors are in risk-off mode, demand for VIX goes up more, as has been the case of late. The opposite occurs when sentiment goes the other way.
Last Friday, the ratio closed at 0.94, having rallied to unity two weeks before that. This was the fourth week in a row the ratio closed at low-90s or higher (Chart 4). This is overbought territory. When this gets unwound, risk assets like equities should rally.
The signal coming from the volatility pit has support from elsewhere in options.
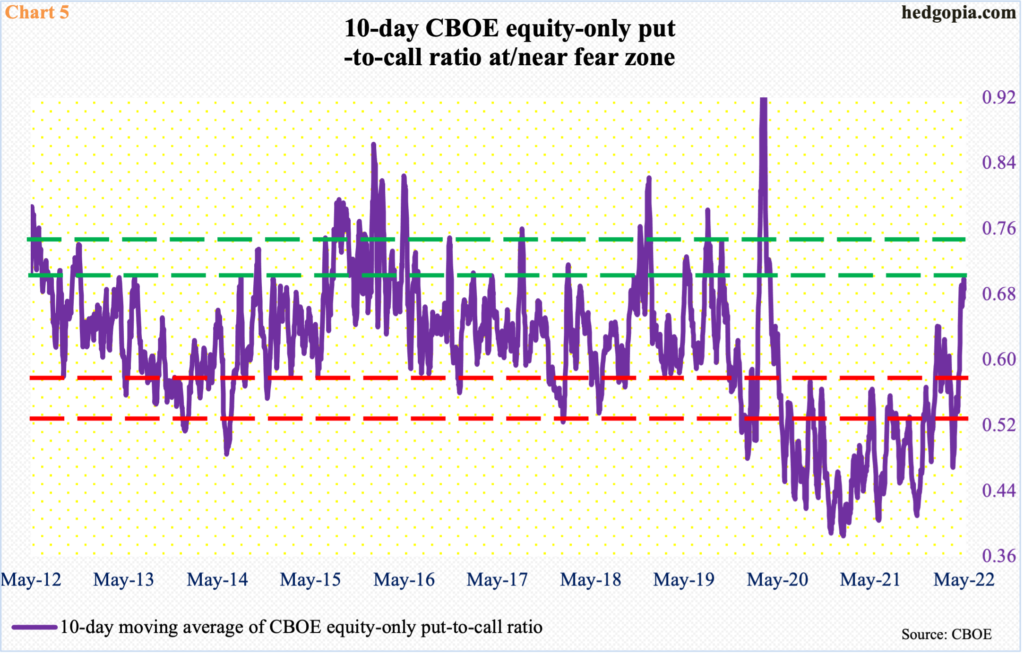
The CBOE equity-only put-to-call ratio has firmed up in recent weeks. Understandably so, as equities have come under pressure and longs are seeking protection. Last week alone, there were two readings in the 0.80s, one in the 0.70s and two in the 0.60s.
Consequently, the 10-day average of the ratio ended last week at 0.687, having risen to 0.699 on Thursday. Historically, low- to mid-0.70s tends to be overbought territory. There are always exceptions, as was the case on March 19, 2020 when the ratio shot up to 0.989, but such overshoots are rare.
Ordinarily, a peak, followed by a drop, in the ratio creates upward pressure for stocks. Right here and now, this is the path of least resistance.
Thanks for reading!
