
In September, Americans saved a mere 3.1 percent of their disposable personal income. This was the lowest since three percent in December 2007. The savings rate has trended lower since peaking at 6.3 percent in October 2015, which means it has been cut in half in a couple of years.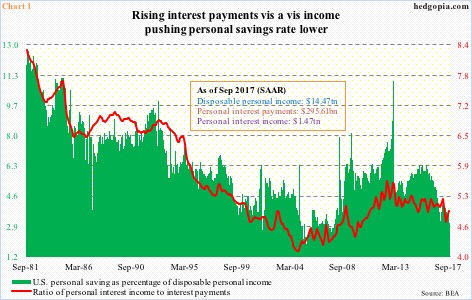
One reason behind this mini collapse in savings is a mismatch between interest income and interest payments. Chart 1 plots the savings rate with a ratio of interest income to payments.
Most recently, the ratio peaked at 5.58 in June 2012. Since then, interest payments have risen by 25.8 percent to a seasonally adjusted annual rate of $295.6 billion, and interest income by 11.8 percent to $1.5 trillion.
The prevailing Fed-engineered low interest-rate environment costs savers, even as rising consumer credit costs more in interest payments. Consumer credit grew from $2.8 trillion in June 2012 to $3.8 trillion this August.
Besides, rates have been inching up. Since December 2015, the fed funds rate has gone up by 100 basis points to 1.16 percent.
The FOMC left interest rates unchanged on Wednesday. But December is a lock, with the futures market pricing in 98-percent odds for a 25-basis-point hike.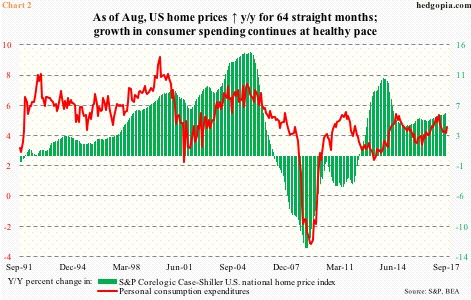
Even with a hike in December, the fed funds rate will still be around 1.4 percent (between 125 and 150 basis points) – historically very low. That said, with each push higher, credit becomes expensive, and likely unavailable for particularly those in the periphery.
In this respect, Chart 2 is relevant.
Housing’s role in the U.S. economy needs no elaboration. In the present context, this is even more so as a sentiment-booster.
Nationally, according to S&P, home prices rose 6.1 percent year-over-year in August. This was the highest growth rate in 38 months. The last time prices fell was in April 2012. This has to be boosting consumer sentiment, and by default, consumer spending.
The University of Michigan’s consumer sentiment index shot up six points in October to 101.1 – the highest since January 2004. Consumer spending increased 4.4 percent y/y in September – a slight deceleration from 5.1 percent in March this year but still healthy.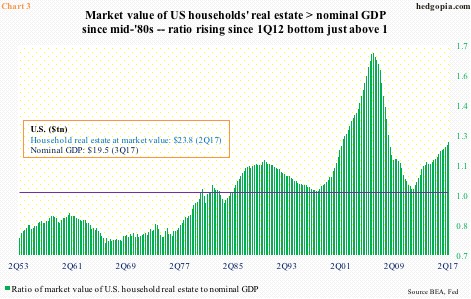
Hence the significance of the Fed’s tightening pace next year and beyond. If a hawk gets to lead the Fed come next March, this can have implications for Chart 3.
The green bars in the chart represent a ratio of market value of U.S. households’ real estate to nominal GDP – $23.8 trillion and $19.5 trillion in 2Q17, respectively. After the bubble burst, the value of real estate fell as low as $16 trillion. In 1Q12, the ratio was near unity – 1.02, to be exact. Then it rose, reaching 1.24 in 2Q17.
The persistent rise in home prices over the years has helped boost homeowners’ equity, which in 2Q17 totaled $13.9 trillion. This made up 58.4 percent of real-estate value – an 11-year high.
Once again, for consumers, this is nothing but a confidence-booster, and probably leads them to overlook the issue of anemic savings – for now. This can change once those green bars in Chart 3 begin to get smaller, which in due course will be the case in a rising rate environment. The only unknown right now is the pace, which will be decided by who gets to head the Fed.
Thanks for reading!
