
Gold just broke out of a massive base, suggesting much higher prices in the future. At the same time, its current pace of gains has a parabolic touch to it. A pullback to successfully retest the breakout will greatly strengthen gold bugs’ hands longer-term.
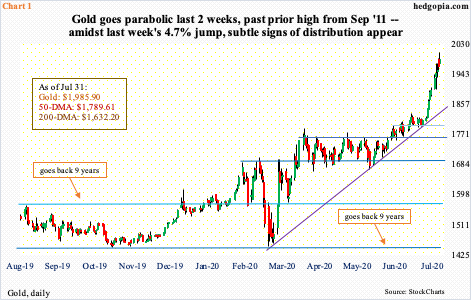
The glitter is back. Gold ($1,985.90/ounce) is hitting new highs.
Last Monday, the metal took out the prior high of $1,923.70 from September 2011. By Friday, it posted a new all-time high of $2,005.40. As recently as March 16, gold bottom-ticked $1,450.90. That was a week ahead of the Fed’s March 23rd announcement of open QE; the S&P 500 bottomed on that date as well.
Defense of $1,450s, which goes back nine years, opened the door to reclaiming one after another resistance – $1,560s, $1,700 and then $1,750s-60s, not to mention the 50- and 200-day moving averages (Chart 1).
Particularly the last two weeks, gold has pretty much gone parabolic. Last week, it rallied 4.7 percent. Amidst this, there were subtle signs of fatigue as well. Both Tuesday and Wednesday were marked by a spinning top, while Friday produced a candle with a long upper shadow. The daily upper Bollinger band is sharply rising, and gold is rallying with it.
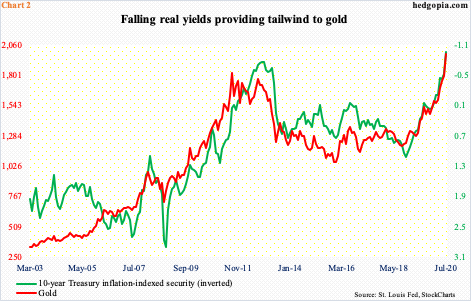
Real yields are a huge driver of gold prices. Chart 2 plots the yellow metal with the 10-year Treasury inflation-indexed security (TIIS), which is inverted. These are debt securities with coupon and principal payments indexed to inflation. The two show a pretty tight relationship in the chart.
TIIS has been in negative territory since February. This is because even though inflation remains subdued, rates are darn too low. In the 12 months to June, core CPI (consumer price index) and core PCE (personal consumption expenditures) grew 1.2 percent and 0.95 percent, respectively (chart here). Concurrently, 10-year Treasury notes were yielding 0.54 percent at the end of last Friday.
In fact, the amount of debt with a negative yield stands at $14 trillion globally. In this topsy-turvy world, borrowers get paid to borrow. In this environment, it is possible insurance and pension funds are preferring gold over debt instruments yielding next to nothing or even negative.
Gold’s rally suggests it is beginning to attract a new breed of investors and/or it is pricing in much steeper negative rates. Rates are already negative in the euro zone and Japan. Chair Jerome Powell says the Fed is not looking at negative rates as a policy tool, but since he would not completely rule it out, investor fascination with the idea lingers on.
Negative or not, US rates are bound to stay low for years. On March 15, in order to deal with the Covid-19 hit to the economy, the Fed cut the fed funds rate to a range of zero to 25 basis points. It cannot go any lower, unless it is pushed into negative territory.
The last time the benchmark rate was this low was during the financial crisis of 2008-2009. Great Recession ended in June 2009, but rates remained zero-bound for seven years before the Fed began raising them in December 2015. But it had to reverse its decision before the fed funds rate hit 2.5 percent.
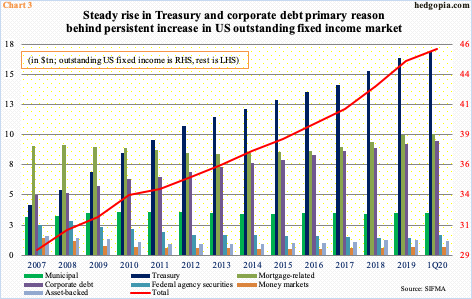
A leveraged economy is unable to cope with higher rates for too long. The US national debt is now bigger than the economy itself – $26.6 trillion versus nominal GDP of $19.4 trillion. The lower the interest rate, the less its interest expense. This is true for corporations, households, and what not. The outstanding US fixed income market continues to grow (Chart 3).
Rates are not in a position to sustainably rally.
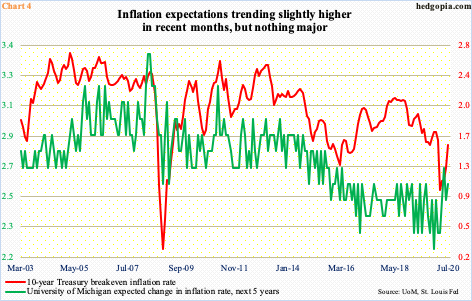
With this as a background, gold bears must hope inflation expectations do not begin to sustainably perk up. Inflation, as pointed out earlier, remains low. Inflation expectations in recent months have risen but from a very low base.
Last month, the University of Michigan’s ‘expected change in inflation rate, next five years’ sub-index stood at 2.6 percent, versus 2.3 percent in March and 2.2 percent last December. The 10-year Treasury breakeven rate similarly was 1.55 percent, up from 0.99 percent in March (Chart 4). The breakeven rate implies where markets expect inflation to be in the next 10 years.
In other words, markets are not worried much of incipient inflation. Even then, gold has been able to rally the way it has. In an inflationary period, gold gets more tailwind as real rates get driven further into negative territory.
Commodities are priced in dollars, gold including. How the greenback behaves will obviously have a bearing on the metal.
The Fed’s ultra-loose monetary policy, made up of both conventional and unconventional tools such as QE, has not helped the dollar. Its balance sheet grew nearly $3 trillion in three months through the high of $7.17 trillion in the week to June 10, before dropping $219.9 billion to last week’s $6.95 trillion.
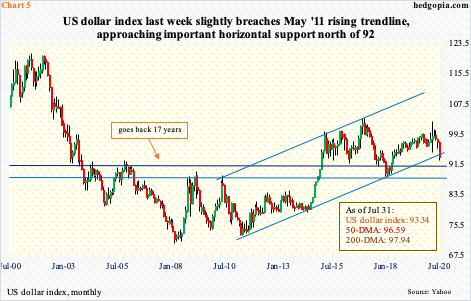
Most recently, the US dollar index (93.34) reversed lower after tagging 103.96 on March 23, the same day the Fed announced QE would have no limits and said it would also begin buying investment-grade corporate bonds, which in April was expanded to also include junk bonds.
From that high, the US dollar index kept dropping, until last Friday’s intraday low of 92.52. In between, tons of support gave way, including both the 50- and 200-day. Last week, it also breached a rising trend line from May 2011 when the index bottomed at 72.70, albeit ever so slightly. Friday’s low came just above horizontal support around 92, which goes back 17 years. It is possible the index stabilizes around here. Failure to do so raises the odds it heads toward 88-89 (Chart 5).
In the event of a rally near term, nearest resistance lies at 94.60s.
Given how overbought gold is on multiple timeframes, a stable dollar at this point in time likely gets used as an excuse to lock in gains.
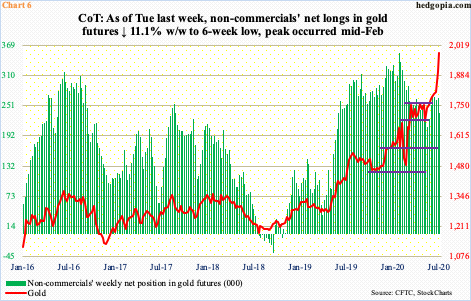
Non-commercials in this regard cut back net longs in gold futures last week, to 236,801 contracts. In fact, they have been reducing their holdings since mid-February when they were net long a record 353,649 contracts (Chart 6). Last week’s 11.1-percent, week-over-week drop is interesting considering it came after the recent surge in the metal’s price. These traders nevertheless remain heavily net long and can decide where gold goes next.
Last week’s breakout is massive given it is a nine-year base. Using a measured-move approach, technicians in due course will be looking for another $800-plus move from the breakout. That said, the current pace of gains is unsustainable. For its own good, gold needs a rest, and is likely in the process of doing so. In ideal circumstances, it will be healthy if it pulls back to retest $1,920s, does so successfully and then launches into another up leg.
Thanks for reading!
