
U.S. homeownership continues to take it on the chin, with 1Q15 matching the 1Q93 low of 63.7 percent. A 22-year round-trip! The series goes back to 1Q65; the all-time low was set that year at 62.9, which is not that far away from where it is currently.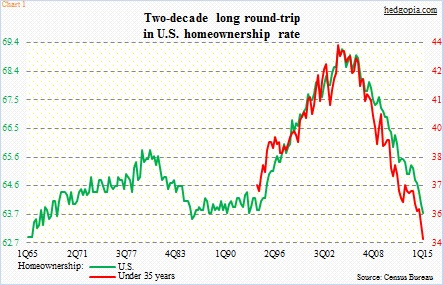
As Chart 1 shows, the all-time highs unsurprisingly came during the housing bubble a decade ago. This is true in all age categories. The adjacent table offers some context in this regard. The Census Bureau divides the series into five age brackets – under 35 years, 35 to 44 years, 45 to 54 years, 55 to 64 years, and 65 years and over.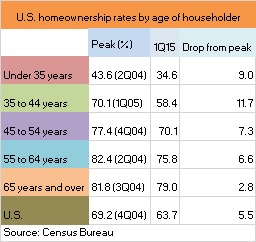 Instinctively, the higher the age bracket, the higher the ownership rate. The latter two categories, for instance, likely consist of households that are either at the peak of their career or have retired, and have either paid up their mortgage or about to.
From this perspective, the ‘under 35 years’ category plays a crucial role in housing. This is the age group that mostly consists of first-time buyers. In a normal market, homeowners list their home to either trade up or downsize, a lack of which will tighten inventory for first-time buyers.
Since the peak in 2Q04, the homeownership rate for ‘under 35 years’ has dropped by nine percentage points, and ’35 to 44 years’ by 11.7 percentage points. The lower their share, the smaller the pool of households moving up the chain. In March, the percent share of first-time buyers of existing homes was 30 percent – very low historically. Going back to 1981, as per the National Association of Realtors, the long-term average is 40 percent.
There is a whole host of reasons as to why this may be happening – ranging from sluggish incomes to tight inventory to recovery in prices that have far outpaced inflation. And then there is this.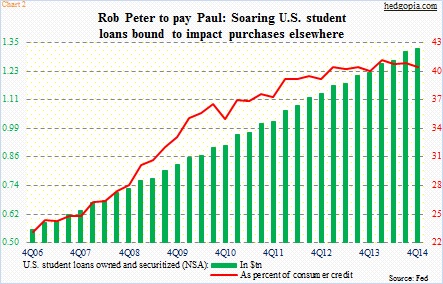
Look at those green bars in Chart 2. Classic ‘from the lower left to the upper right’ journey! Pre-Great Recession, U.S. student loans stood at just north of $500 billion in 1Q06. As of 4Q14, they had surged to $1.3 trillion. As a percent of consumer credit, their share has risen to 40 percent, from 22 percent in 2006.
This is bound to have implications for housing. Qualifying for a mortgage is already difficult, as lenders are nowhere near as free-wheeling as they were during the bubble days. The burden of student debt does not help. Paying off these loans probably means not saving enough for a home down payment. Looking at the sharp rise in student debt, this is an issue U.S. housing will be grappling with for some time to come.
Thanks for taking the time to read this post.
