
Earnings season is upon us.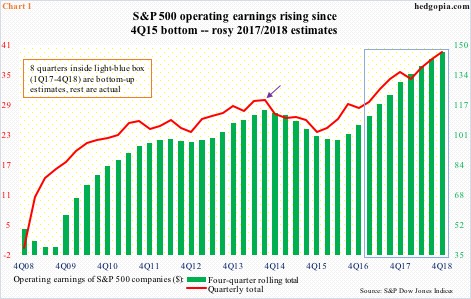
Operating earnings for S&P 500 companies are expected to rise from $23.97 in 1Q16 to $29.14 in 1Q17 – an increase of 21.6 percent. This followed a 21-percent year-over-year rise in 4Q16 – from $23.06 to $27.90.
After peaking at $29.60 in 3Q14 (arrow in Chart 1) before coming under pressure for five quarters, earnings have been growing since 1Q16 (bottomed at $23.06 in 4Q15).
Energy is no longer a drag. After dropping for six consecutive quarters through 2Q16, energy earnings rose in both 3Q an 4Q last year, and the trend is expected to continue.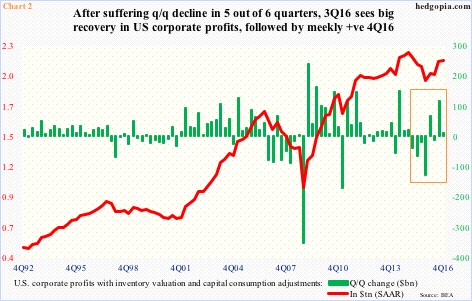
On a broader basis, corporate profits with inventory valuation and capital consumption adjustments, too, bottomed in 4Q15 at a seasonally adjusted annual rate of $1.97 trillion. They peaked at $2.22 trillion in 4Q14. The $2.15 trillion in 4Q16 was still below that peak, but did grow 9.3 percent y/y. This was the second straight y/y growth in profits, and was preceded by five quarterly declines in a row.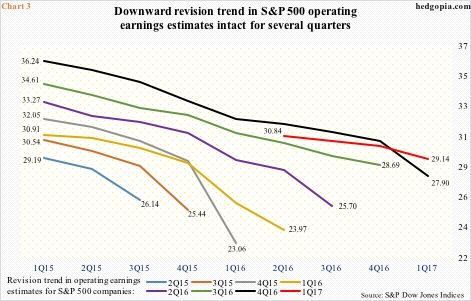
Earnings in recent quarters have been rising, but the revision trend is still down. And this is not a recent phenomenon.
Chart 3 highlights progression of operating earnings estimates for S&P 500 companies going back to 1Q15. For 4Q16, for instance, earnings were expected to come in at $36.24 in 1Q15, and ended up actually earning $27.90. That is a huge delta.
On a related note, back in February 2015 the sell-side expected 2016 to earn $137.50; when it was all said and done, $106.26 was earned. For whatever it is worth, 2017 is expected to bring in $129.78 and 2018 $146.48, and were as elevated as $141.11 in January last year and $147.21 in January this year, respectively. Notice the optimistic tall green bars on the right side of Chart 1.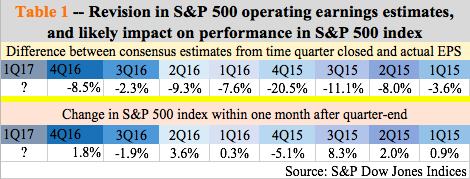
It is almost as if the sell-side is killing two birds with one stone. As a year starts out with elevated estimates, this helps suppress forward P/E, which is what the majority use as a valuation tool. On 2017 estimates, for instance, the S&P 500 currently trades at 18.2 times and at 16.1 times on 2018 estimates, but using trailing 12 months this jumps to 21.1 times. Then, as the estimates get gradually revised downward, this helps create a lower bar for companies to jump over.
Table 1 goes back to the prior eight quarters and looks at the revision trend from the time a quarter has come to an end and as companies begin reporting. In 4Q16, for instance, earnings were expected to come in at $30.50 as the quarter ended. As noted earlier, the quarter earned $27.90.
Would this trend repeat itself in 1Q17?
The quarter has just ended, with a prevailing negative revision trend – from $30.84 in July last year to $29.14 as of last Friday. In the prior eight quarters, estimates continued lower even as companies began to report earnings. And in six out of the eight, the S&P 500 was higher within a month (except for 3Q16 and 4Q15). This favors rally odds, with possibly a twist this time around.
Major U.S. indices are hardly in sync. The Russell 2000 small cap index acts the weakest, while the Nasdaq composite the strongest, and both the Dow Industrials and the S&P 500 (2360.16) tested their respective 50-day moving average twice in the last seven sessions. Should this average give way, this may end up trumping any potential earnings-revision tailwind.
Thanks for reading!
