
Spot gold this week took care of not one but two crucial resistance.
First, it broke out of a descending trend line going back to April 2013. That trend line persistently repelled gold’s rally attempts, the most recent of which was in October of last year (Chart 1).
This was then quickly followed by a break out of a November 2009 horizontal trend line.
With the explosive six-week rally, the metal has already retraced 38.2 percent of the decline between the September 2011 peak (1,923.7) and the December 2015 low (1,045.4). Should the momentum continue, a 50-percent retracement puts the spot at 1,317.
Gold (1,247) looks way extended on a daily chart, but has room to run on a monthly chart. With one twist. First, it is worth pointing out that it just had a monthly MACD bullish crossover. But here is the twist.
Monthly momentum indicators such as the RSI and CCI have reached the median. More often than not, should thrust begin to weaken, these indicators can begin to turn back down from here. Given gold’s price action of late, it may be premature to expect that.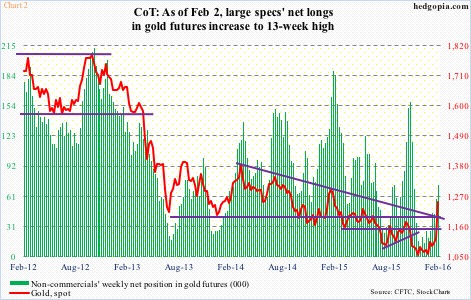
One strong clue can come from non-commercials who in the past have done a great job of riding the ups and downs in the metal. Most recently, the spot troughed on December 3rd, with non-commercials’ net longs in gold futures making a 13-year low two days before that. Since then, net longs have gone up from 9,750 contracts to 72,822 contracts, and the spot has, well, gone through the roof.
Their holdings potentially will look a whole lot different when the latest numbers are reported later this afternoon. But the main thing to watch for is how they were positioning themselves right after the breakout.
Thanks for reading!
