
On February 11th, spot gold closed up 4.1 percent to $1,263.9/ounce, surging intra-day as much as 5.6 percent (blue arrow in Chart 1). It was a high-volume session. A healthy $535 million moved into GLD, the SPDR gold ETF, in that session (courtesy of ETF.com).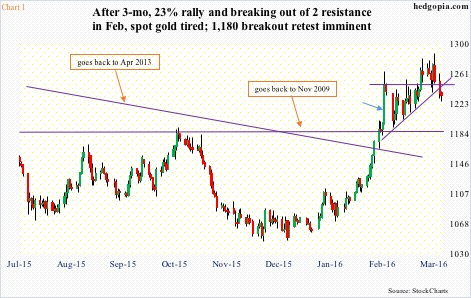
Here is the irony.
Gold essentially went sideways since that spike. On March 11th, the metal did rise to $1,287.8 intra-day but was unable to hang on to the gains, producing an ugly looking red candle. That was the highest price gold commanded since January 2015.
In the one month since that February 11th surge, GLD attracted $3.5 billion, but all gold did was churn. At least some of that money is now underwater. Who are sitting pretty? The $2.1 billion that moved into the ETF from December 3rd (2015) through February 10th. Gold bottomed at $1,045.4 on December 3rd.
Here is the thing.
The metal acts like it wants to go lower for now. Since the March 11th spike reversal, it is down north of four percent.
Since the aforementioned low last December, it rallied north of 23 percent. In three months! Since that low, gold rallied pretty much uninterrupted, give and take.
Consequently, on a daily chart, the yellow metal has remained overbought for a while now. Recently, weekly conditions have entered overbought territory as well.
With this as a background, gold coming under some pressure should not be a big deal. At least not yet.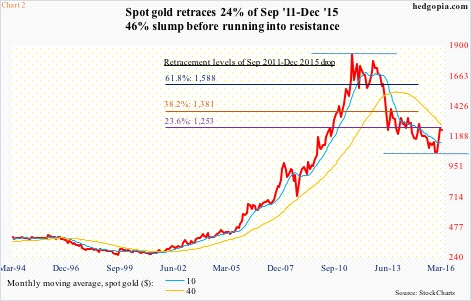
Earlier, the metal suffered a four-year drop during which it gave back 46 percent. Using Fibonacci retracements, the March 11th peak retraced a little over 23.6 percent of that September 2011-December 2015 decline. (Chart 2 uses monthly close, hence does not properly reflect the daily swings. As stated earlier, so far this month, gold made a high of $1,287.8. which is slightly more than a 23.6-percent retracement of that four-year decline.)
Gold also faces resistance at its 40-month moving average (Chart 2).
In any event, this was as good a reason as any for gold to pause.
The question is, is this a mere pause or the beginning of a reversal?
Last Thursday, post-ECB stimulus, gold rallied 1.5 percent, but gave it all back the very next session. China is adding stimulus. Japan is going all guns blazing. Later today, the Fed is likely to adopt a less dovish message than it did three months ago when it raised rates.
In a vein attempt to ignite inflation – a strategy that will probably backfire sometime in the future – major central banks are printing money as busy as ever. Yet gold hesitates to continue to rally.
If this is merely a pause, then gold should generate buying interest at/near $1,180 at best and $1,140 at worst.
The $1,180 level has proven to be an important price point going back to November 2009. Gold broke out of it five weeks ago (Chart 1). Similarly, horizontal support at $1,140 goes back to November 2014; as well, a declining April 2013 trend line converges there. The now slightly rising 200-day moving average lies at $1,136. Whether or not gold bugs are able/willing to defend these levels would be a big clue.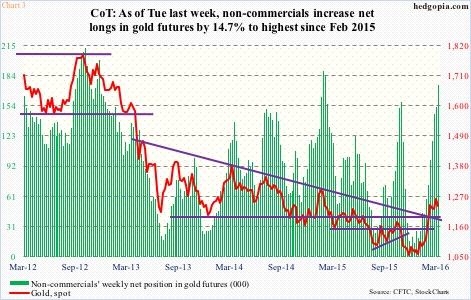
The second clue likely comes from non-commercials who have been rightly adding to net longs in gold futures the past three months. They held 9,750 contracts in the week ended December 1st. (Gold bottomed on December 3rd.) By Tuesday last week, they held 174,810 contracts, which were the highest since February 2015. Lately, though, gold has not moved much.
Once again, the metal has essentially gone sideways in the past month – a fact that could begin to weigh on both non-commercials as well as GLD longs that are either breaking even or under water.
This amidst some signs of distribution. A lot is riding on what looks like an imminent $1,180 retest.
Thanks for reading!
