
US housing increasingly is in the midst of strange dynamics, one hurting the economy and the other potentially helping.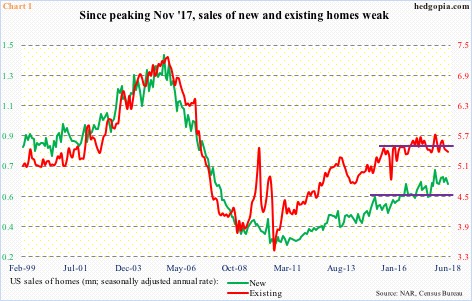
Home sales have weakened since reaching a cycle high last November, but this has not much impacted the price.
In June, sales of existing homes fell 0.6 percent month-over-month to a seasonally adjusted annual rate of 5.38 million units. Last November’s 5.72 million was the highest since February 2007. New home sales in June declined 5.3 percent m/m to 631 million (SAAR), with 712,000 last November the highest since October 2007 (Chart 1). The weakness is occurring at a substantially lower level than during the bubble of last decade.
Using a 12-month average, existing home sales in particular are in the process of rolling over (not shown here).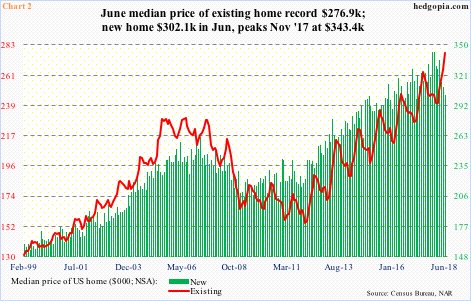
Price, on the other hand, is going on its own merry way.
In June, the median price of an existing home increased 4.5 percent m/m to $276,900 – a new record. The bubble high of $230,400 in July 2006 was surpassed a long time ago. In new home sales, a new high of $343,400 was reached last November. June came in at $302,100, but this was still more expensive than the prior peak of $262,600 in February 2007 (Chart 2).
The last time the median price of an existing home dropped year-over-year was in February 2012.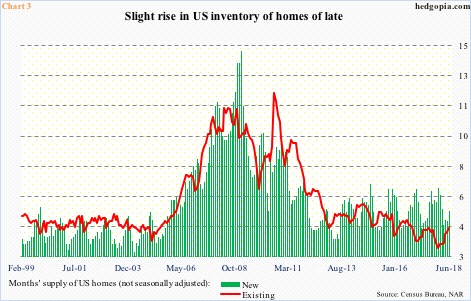
The persistent increase in house prices may very well be impacting sales. Sales have softened, and inventory is beginning to rise – although from a very suppressed level. In June, there were 1.95 million existing homes available for sale – a 13-month high and equivalent to 4.3 months’ supply, matching last July’s.
Similarly, inventory of new homes available for sale in June was 303,000. This was the highest since March 2009, and amounted to 5.3 months of supply in June. If sales continue to weaken, given the amount of homes available, months’ supply can quickly shoot up.
The bigger question is, will the rise in inventory help temper the prevailing strength in price? Possibly, and this dynamic could already be in play in new homes.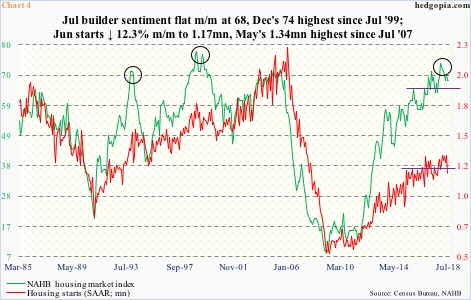
For now, weak sales are beginning to impact housing starts. In June, they fell 12.3 percent m/m to 1.17 million units. May’s 1.34 million was the highest since July 2007. Builder sentiment is dropping from a very elevated level, with the NAHB housing market index at 68 in July, down from 74 last December. That was the strongest reading since July 1999 (Chart 4). In worse-case scenario, this can go a lot lower.
Lesser building activity obviously cuts into economic growth.
The persistently rising prices makes it tough for buyers. Particularly the first-time buyers, which made up 31 percent of existing home sales in June, versus 32 percent a year ago. The other side of the price coin is a buildup in home equity.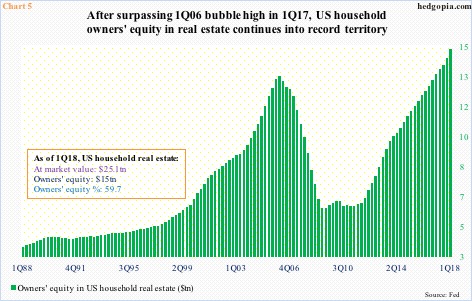
In 1Q18, US households held $15 trillion in home equity. When Great Recession ended in 2Q09, this was $6 trillion. The $9-trillion increase in nine years is massive, and goes a long away toward boosting consumers’ mood and their discretionary spending. This is a plus for the economy. The share of personal consumption expenditures in GDP was 68.1 percent in 2Q09, rising to 69 percent in 1Q18 (was 69.2 percent in 1Q17).
The risk going forward is this. If home sales continue on their current trajectory, sooner or later it begins to get reflected in price, and that in turn potentially affects consumer spending – adversely, of course.
Thanks for reading!
