The rise in supply of new homes is coming amidst relatively soft sales, inflated prices and now rising mortgage rates. Concurrently, builder sentiment is off its high but remains elevated, even as ITB is below potentially crucial $66.

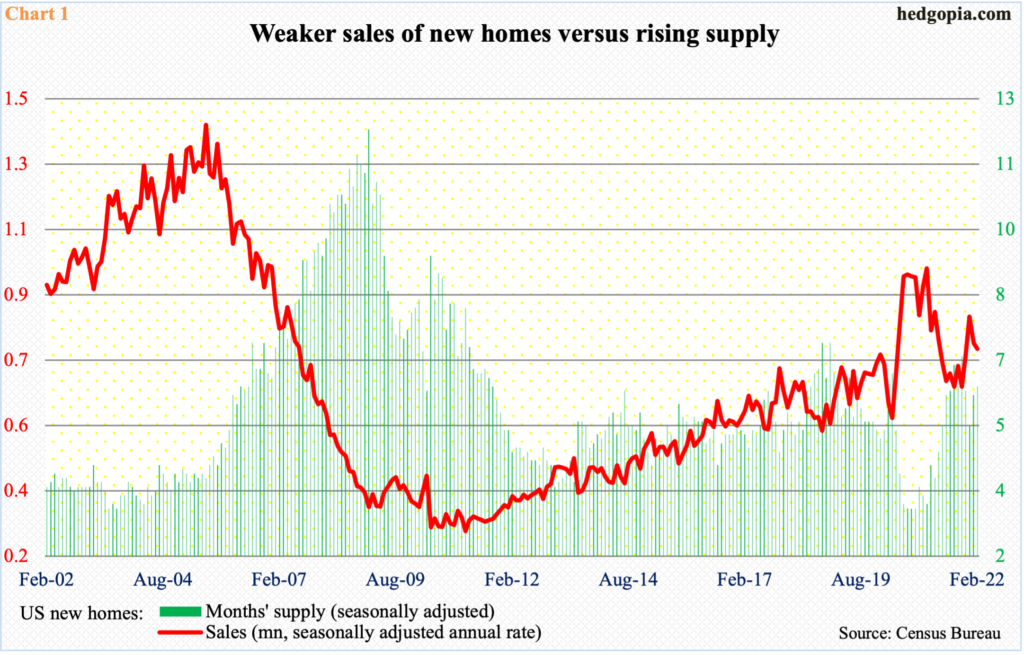
Sales of new homes are soft – relatively. In the current cycle, the high was posted in January 2021 when 993,000 units (seasonally adjusted annual rate) were sold. This was the highest monthly total since December 2006.
Last month, sales came in at 772,000 units, down two percent month-over-month to a three-month low. Concurrently, months’ supply rose to 6.3 – a four-month high; as recently as January last year, this metric was 3.6 (Chart 1).
Inventory is building and sales could soften more.

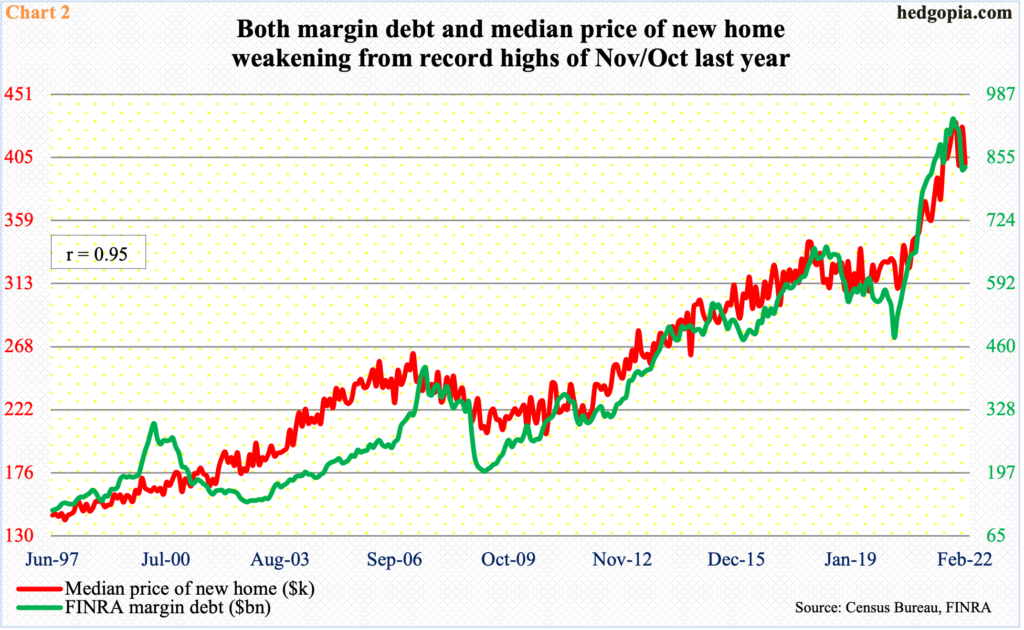
Home prices have simply gone through the roof. Using new homes, the median price dropped 6.3 percent m/m in February to $400,600, but this was still up 10.7 percent year-over-year. The y/y growth rate peaked last August at 24.2 percent; in November, the median price reached an all-time high of $430,300, which doubled in a decade.
Incidentally, the median price of a new home tends to correlate well with margin debt. This is perhaps so because both represent willingness to take on risk, and this happens when times are good, which was the case in the post-pandemic world.
FINRA margin debt peaked last October at $935.9 billion, nearly twice the post-pandemic low of $479.3 billion reached in March 2020. By February this year, this was down to $835.3 billion, down $100.6 billion from the peak.
If margin debt has peaked – it probably has – and if the strong historical relationship with the median price of a new home maintains, the latter could continue lower, which could provide relief to potential buyers. But the fact remains that the price has already gone up too much to potentially price out a large chunk of would-be buyers (Chart 2).

Then, there is the issue of the recent spike in mortgage rates.
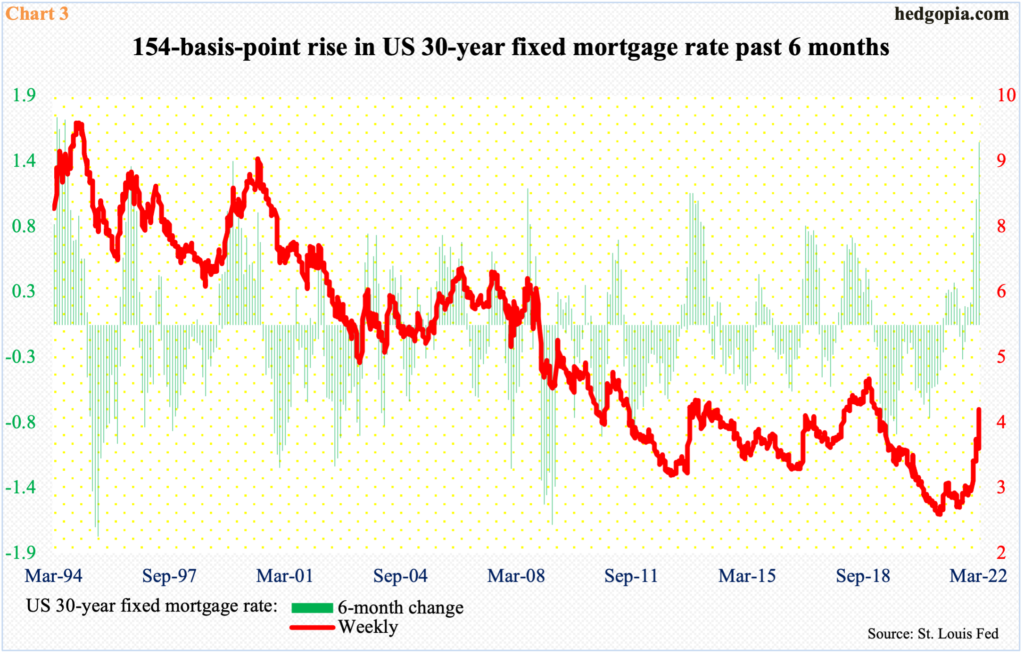
Just this week alone, with one session to go, reacting to Federal Reserve Chair Jerome Powell’s hawkish interest-rate comments, the 10-year treasury yield jumped 19 basis points to 2.34 percent. Rates have been trending higher for a while now; they were 1.13 percent last July and 0.40 percent in March 2020.
The 30-year fixed mortgage rate accordingly has moved up – from 2.65 percent in January last year to this week’s 4.42 percent. On a six-month basis, the 30-year is up 154 basis points, which is the steepest rise since July 1994 (Chart 3). This has to reduce the pool of potential buyers.

In all probability, housing is headed for tough times ahead.
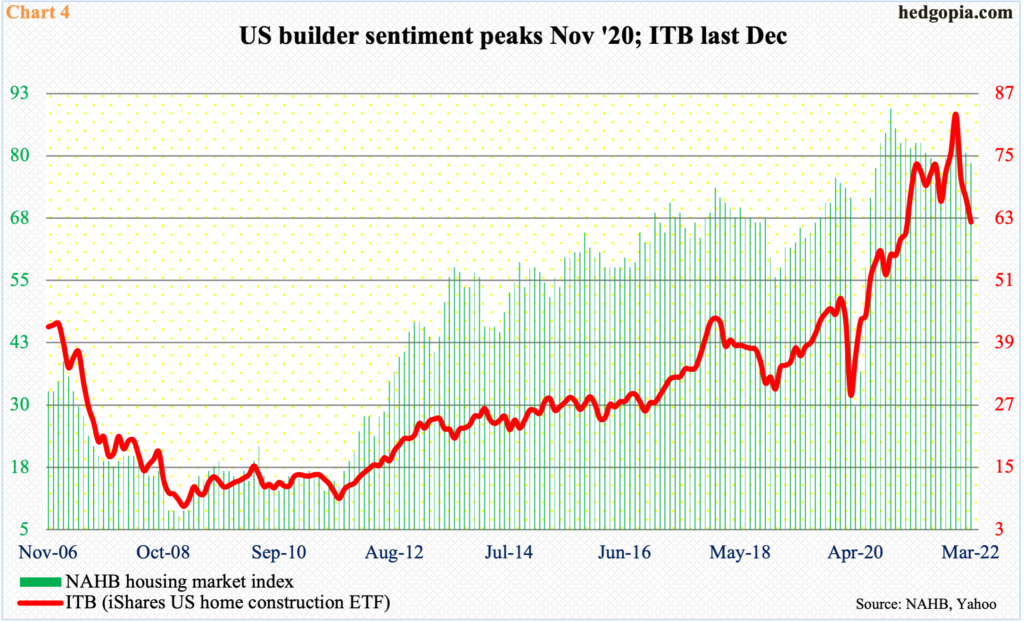
Thus far, homebuilder optimism is hanging in there. The NAHB housing market index peaked as far back as November 2020 at 90, which was three times the post-pandemic low of 30 posted in April that year. Since that high, sentiment has gradually weakened, with this month’s reading at 79, down two m/m. This is still elevated territory (Chart 4).
It so happens that ITB (iShares US home construction ETF) moves more of less hand in hand with builder optimism. Last December, it hit an all-time high of $83.43 and headed lower, bottoming at $60.02 on February 24. Rally attempts off that low have not amounted to much.
For over a year now, $66 has proven to be a level of interest for bulls and bears alike. For now, this is the one to watch. The week is one session from being done, and ITB closed Thursday at $62.19. Inability to save last month’s low can bring out more sellers.
Thanks for reading!

