
U.S. households are flush with cash – if we look at their bank deposits. The question is, does this represent dry powder for stocks?
Households’ currency and deposits including money market fund shares totaled $10.7 trillion in 4Q15, having increased by $2.6 trillion post-Great Recession. The green bars in Chart 1 totaled $8.1 trillion in 2Q09.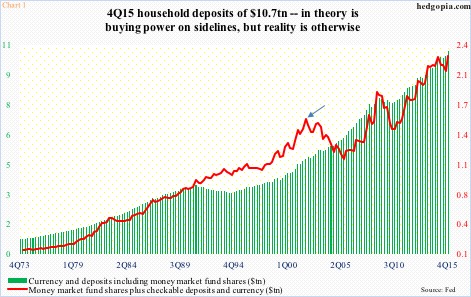
Of the total in 4Q15, foreign deposits were $31.8 billion, checkable deposits and currency $1.2 trillion, time and savings deposits $8.4 trillion, and money market fund shares $1.1 trillion.
Checkable deposits and currency, and money market fund shares are the most liquid, hence of most interest to equities. They totaled $2.3 trillion in 4Q15 – denoted by the red line in Chart 1. Not surprisingly, it is more volatile than the green bars.
However, the ups and downs in the red line do not quite jibe with ups and downs in stocks. For instance, the red line peaked in 4Q01 (arrow in Chart 1), only to bottom in 3Q05. The S&P 500 peaked in 1Q00, bottoming in 1Q03.
Chart 2 sends the same message – that a change in money market funds does not always correlate with a change in the S&P 500.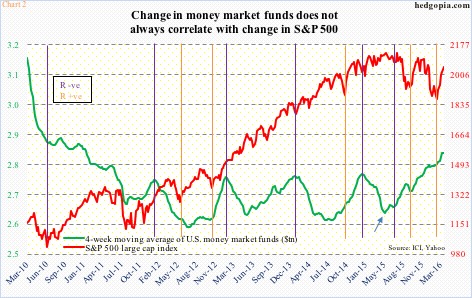
The green line in Chart 2 is a four-week moving average of money market funds. In the week ended March 16th, they totaled $2.76 trillion – $1.76 trillion in institutional and $1 trillion in retail. The four-week average troughed in the week ended May 11th (2015) and began to rise. The S&P 500 peaked in that month. However, there has been plenty of other times in which the two moved in the same direction.
Of the 11 instances noted in Chart 2, orange vertical lines represent the occasions in which the S&P 500 and money market funds maintain a positive correlation, and the indigo lines in which the two move in opposite directions.
Ideally, equity bulls would want to see an inverse relationship… money comes out of these funds and finds a home in stocks. In reality, that is not always the case. When money leaves these funds, stocks are not the only option. Bonds are the other primary alternative.
In the week ended last Wednesday, for instance, money market funds shrank by $35.9 billion. But not a penny moved into stocks. In fact, U.S.-based equity funds lost $2.1 billion (courtesy of Lipper).
The bottom line: Money market funds do not have as clean a relationship with stocks as margin debt.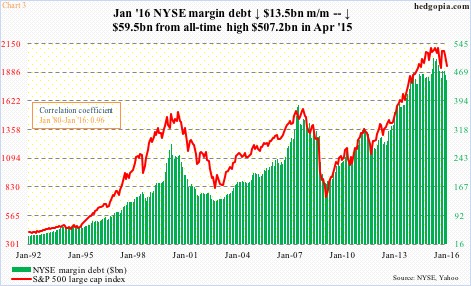
As is evident in Chart 3, the red line and the green bars move in tandem. As goes margin debt, so do stocks. For the last 36 years going back to January 1980, the correlation coefficient between the two is 0.96.
Most recently, NYSE margin debt peaked in April last year at $507.2 billion. By January, this had dropped to $447.7 billion. The S&P 500 peaked in May last year, and by January was down nine percent.
Households’ cash deposits as well as money market funds do not correlate as tightly with stocks. A pile of cash does not necessarily equate to dry powder. Nor does cash leaving money market funds have to find a home in stocks.
Thanks for reading!
