
Chart 1 looks normal except for one thing. In the current cycle, the green line has not followed the red line higher. U.S. capacity utilization bottomed out at 66.9 percent in June 2009 and moved higher. The Fed funds rate never got off the floor. It is still stuck there – flat as a pancake. In the meantime, utilization rose to 79.8 percent last November.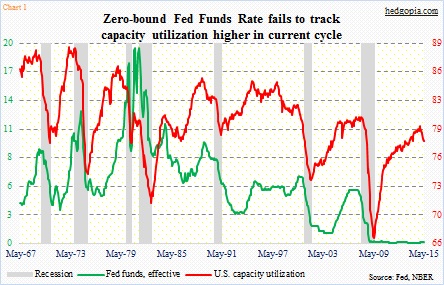
Did the Fed miss a window of opportunity to start tightening? Time will tell.
But on this FOMC-decision day, Chart 2 is pertinent. It once again plots capacity utilization but this time against 12 tightening cycles going back nearly five decades. A quick look at the chart makes one thing clear – rarely does the Fed tighten when utilization is under stress.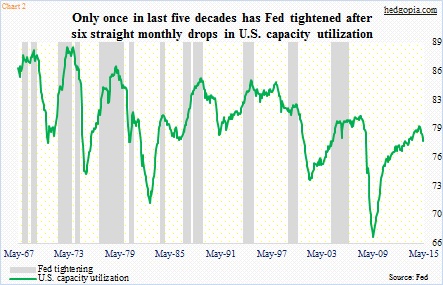
First off, the grey bars in Chart 2 only include the rate hikes once the Fed has raised them three different times, with no easing in between. For instance, in March 1997, there was just one tightening, from 5.25 percent to 5.5 percent, so that has been excluded. Similarly in 1984, in between easing and tightening, there were three hikes beginning March in four meetings, and that has been included. Along the same lines, in December 1986, the Fed went from 5.88 percent to six percent, stood pat for the next two meetings, and then tightened again in the next two, and this has been included.
So why is Chart 2 pertinent? In the current cycle, since the November high, capacity utilization has dropped every single month month-over-month. That makes it six consecutive drops. As the table below shows, in the last five decades, only once has the Fed begun a tightening process after six straight monthly declines in utilization. That was in August 1980.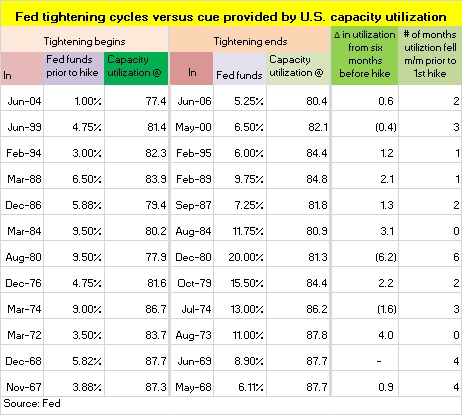
Back then, utilization dropped from 84.1 six months prior to the hike to 77.9 at the time of hike. The Fed nonetheless went ahead and tightened. The reason was obvious. Inflation was rampant. As a matter of fact, they started tightening in December 1976, paused in October 1979 and began hiking again in August 1980. The previous tightening took a toll on utilization, which showed up in 1980.
This time, it is different. Rates are already ultra-low. But utilization is dropping. The Fed is not going to move today. No one expects them to anyway. But the adjacent table can be a good reference point as to what needs to happen before the Fed moves in September, which is when the markets – the majority anyway – expect them to.
By the time the FOMC meets on September 16-17, there will be three more reports – June, July and August. Utilization needs to start showing a change in momentum. So far, not only have there been six m/m declines, but utilization has dropped by a cumulative 1.7 percentage points. This is important. In November 1967, for instance, there were four m/m declines nonetheless versus six months ago utilization was up by nearly a full percentage point, giving the Fed flexibility to tighten.
In the present context, the wider the gap from the November high by the time September rolls around, the harder the sell.
Thanks for reading!
