
U.S. home ownership has ticked up four-tenths of a percent since 2Q15 to 63.8 percent in 4Q15. The 63.4 percent two quarters ago was the lowest since 63.3 percent in 1Q67.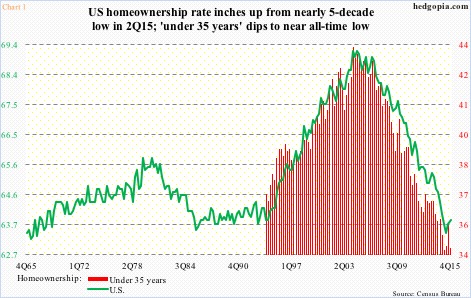
Since the all-time high of 69.2 percent in 2Q04, home ownership has had persistent decline until the low two quarters ago.
The two-quarter uptick is encouraging, with some reservation. The all-important age group – under 35 years – is still struggling. The red bars in Chart 1 made an all-time low of 34.6 percent in 1Q15, jumped to 35.8 percent by 3Q15, only to drop back to 34.7 percent in 4Q15.
This is a group that is definitely not getting much help from the price appreciation trend in homes.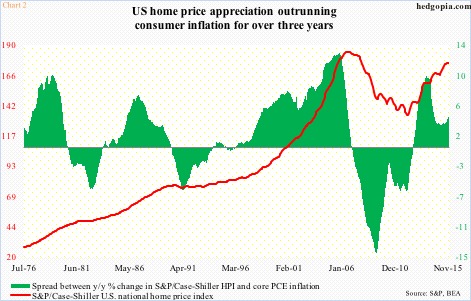
In November, home prices nationally, as measured by the S&P/Case-Shiller home price index, increased 5.3 percent year-over-year. Prices have been rising in the four to five percent range since July 2014. The last time they grew with a three handle was in September 2012.
The green bars in Chart 2 measure the difference between year-over-year percent change in the S&P/Case-Shiller home price index and core PCE (personal consumption expenditures) inflation. Since August 2012, home prices have persistently appreciated more than inflation. The pace has slowed down from the high single digits in the latter months of 2013, but is still running in the three to four percent range. In November, the spread was four percent.
The red line in Chart 2 has had quite a recovery since the low in February 2012, but is still below the all-time high of 184.62 in July 2006. November was 175.71.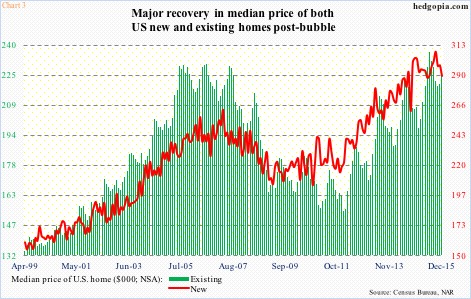
In fact, using median prices of both new and existing homes, the pricing trend looks even stronger. Existing homes sold for a record $236,300 last June, versus the bubble high of $230,400 in July 2006. For new homes, the new record was set last September – $307,600, which easily exceeded the prior high $262,600 in March 2007 (Chart 3).
The point is, rapid home price appreciation is acting against pushing up the red bars and the green line in Chart 1, particularly the latter. It is rather contributing toward suppressing the green bars in Chart 4.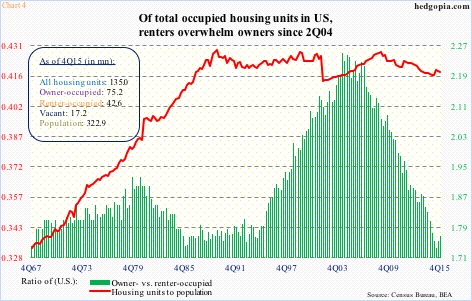
The ratio of owner- versus renter-occupied homes has been under persistent pressure since 2Q04. Back in 4Q05, there were 75,163 owner-occupied homes in the U.S. In 4Q15, this stood at 75,194 – essentially unchanged, with normal ups and downs along the way. Between the periods, renter-occupied homes rose from 33,725 to 42,581. The latter has dropped from 42,878 in 2Q15, resulting in the green bars in Chart 4 rising from 1.74 to 1.77. For continuation higher, Chart 3 needs to behave.
Thanks for reading!
