Dollar bulls are staring at yet another opportunity to step up and defend support.
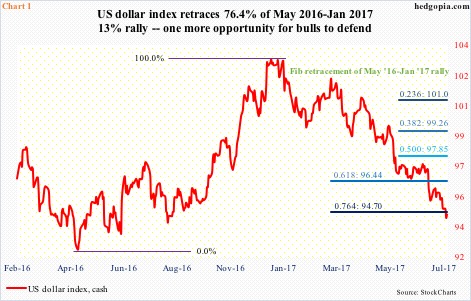
The U.S. dollar index rallied 13 percent between 91.88 in May 2016 and 103.82 early January this year, which was the highest since December 2002. Since that peak, it has been all downhill, violating one after another support.
Along the way, it lost both 50- and 200-day moving averages, with the former dropping fast. Ditto with the 10- and 20-day, with the former repelling rally attempts for several sessions before the index lost yet another near-term support last Friday.
Once again, the dollar index sits at a crucial juncture.
On the way down this year, dollar bulls were unable to defend several Fibonacci retracement levels of the May 2016-Jan 2017 rally. They have another opportunity, with 94.70 representing 76.4 percent retracement (Chart 1).
Fibonacci levels can be useful. Even better if they coincide with other important support, which is the case now.
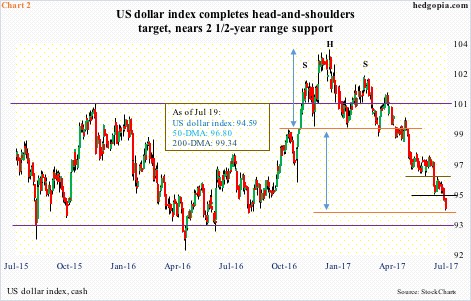
Over several months late last year and early this year, a head-and-shoulders pattern formed on the dollar index. The neckline was broken this April, followed by completion of the measured-move target this week (Chart 2).
Tuesday’s intraday low of 94.28 also came close to testing support going back two and a half years.
The dollar index rallied north of 25 percent in nine months before peaking in March 2015 at 100.71. This proved to be an important price point – unsuccessfully tested in November/December 2015 and one which it falsely broke out of last November.
Concurrently, a floor was forming just north of 93. Except for that false breakout, the index has essentially been range-bound for two and a half years, hence the significance of both the floor and the ceiling.
Should the index retrace the whole May 2016-Jan 2017 move, it drops out of that range. This scenario likely comes to pass if non-commercials in US dollar index futures continue to show disinterest. They are an important player.
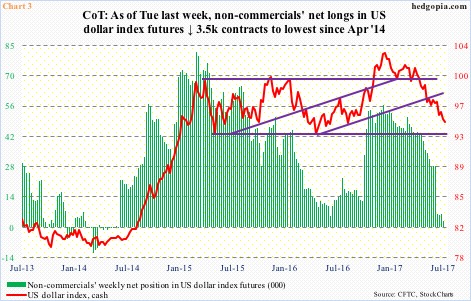
The peak in the cash in March 2015 coincided with a peak in non-commercials’ net longs in US dollar index futures. Holdings went from 81,270 contracts to 4,692 in June last year. The subsequent buildup in net longs peaked last December at 56,712, which once again coincided with a peak in the cash (Chart 3).
As of Tuesday last week, they held 2,340 contracts – the lowest since April 2014. The last time they went net short – albeit by only a small amount – was in June that year, when the cash was getting ready for the afore-mentioned nine-month, 25-percent jump.
If they are waiting for the cash to stabilize – rather than be a catalyst themselves – then demand needs to come from elsewhere. Technically-inclined dollar bulls may find the current level interesting, even tempting. The question is, will they step up to the plate?
Nearest resistance lies at 95.25, which approximates the 10-day, followed by 96.50 (Chart 2).
Thanks for reading! Please share.

