U.S. real GDP grew 0.7 percent in 1Q17. This was the weakest quarter since a negative reading three years ago.
The Atlanta Fed’s GDPNow model forecasts growth snapping back to 4.1 percent in 2Q17.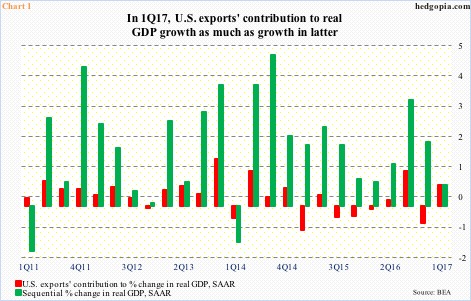
Irrespective of quarterly swings, growth remains subdued. The post-Great Recession average of 2.1 percent compares poorly to the long-term average of 3.2 percent going back to 2Q47.
In 1Q17, exports’ contribution to real GDP growth was 0.68 percent – nearly as much as GDP growth (Chart 1). (Contribution from personal consumption expenditures was 0.23 percent, 0.69 percent came from gross private domestic investment, while imports deducted 0.61 percent, and government consumption expenditures and gross investment deducted 0.3 percent.)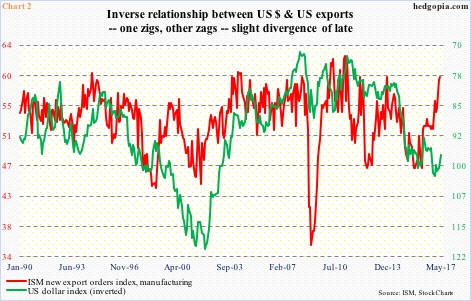
It is possible exports’ contribution continues to be decent in 2Q17.
In April, the ISM manufacturing new export orders index rose five-tenths of a point month-over-month to 59.5, matching the high of November 2013 (Chart 2). (Services export orders jumped three points m/m in April to 65.5 – the highest since May 2007.)
The dollar could be playing a role. In Chart 2, the US dollar index (97.03) is as of last Friday. May-to-date, it declined another 1.9 percent m/m.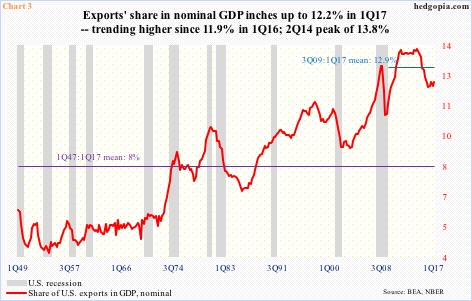
Of late, the dollar has been more of a tailwind to U.S. exports. This is in contrast to the headwind it provided when the dollar index rallied north of 25 percent in nine months before peaking at 100.71 in March 2015.
Consequently, in 2Q14, as a percent of nominal GDP, exports’ share peaked at 13.8 percent, subsequently bottoming at 11.9 percent in 1Q16. Four quarters later, this rose to 12.2 percent (Chart 3). The trend is improving.
On an absolute level, exports peaked at a seasonally adjusted annual rate of $2.39 trillion in 3Q14. This is yet to be surpassed, with 1Q17 at $2.32 trillion. Exports have been rising since bottoming at $2.18 trillion in 1Q16. This also marked a bottom as a share of nominal GDP.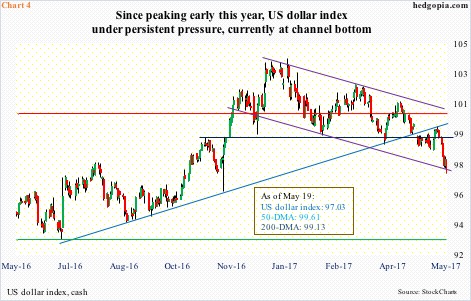
Hence the significance of which way the dollar trends, or has trended in recent months. The prevailing trend has been favorable.
Since the afore-mentioned March 2015 peak, the US dollar index retreated to 93.15 by May that year, and has essentially been range-bound. In Chart 4, the range has been identified by red and green horizontal lines.
The dollar index broke out last November, but only to peak early this year, followed by a drop back into the range. It also lost a rising trend line from last May. Since the January 3rd high, it has shed 6.5 percent.
Rather revealingly, the dollar index has diverged from the Fed’s tighter monetary posture.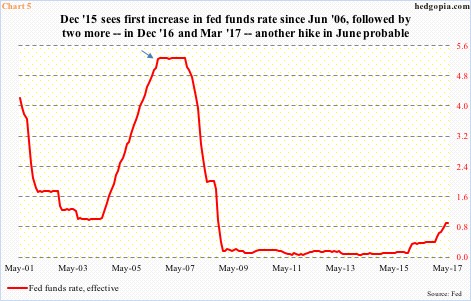
Back in November 2015, right before the December 2015 hike in the Fed funds rate – the first since June 2006 (arrow in Chart 5) – the dollar index unsuccessfully attempted to break out. There have been two more hikes since – December last year and March this year.
A June hike (meeting on 13-14) is pretty much a lock, with odds of a 25-basis-point rise at 79 percent by last Friday. After the March hike, the Fed suggested it would like to move at least two more times this year. The dollar index does not care. It cannot break out.
From the Fed’s perspective, this is good. If the dollar responded positively to tighter monetary policy, it would essentially act as stealth tightening.
This is also good for exports.
As things stand, the dollar index is at a good spot to at least try to stabilize. It is at the low end of a falling channel (indigo color in Chart 4), and remains oversold – particularly on daily and weekly basis.
Should it manage to rally, resistance is galore – 99.20 (dark blue line in Chart 4); 100, which will test the underside of the broken May 2016 trend line (light blue); and 100.7 (red line). How the index acts around these levels will decide where it goes, and how it reverberates through the economy – both domestic and global – and of course exports.
Thanks for reading!

