
Global trade is on the back foot. US-China trade tensions can be partly blamed for this, but as far as US exports are concerned, the US dollar plays a role. The US dollar index has trended higher for nearly a year and a half. It just faced resistance at the upper bound of a rising channel. Near term, the path of least resistance is down. How non-commercials behave at/near support likely decides the next major trend for the greenback and how US exports perform.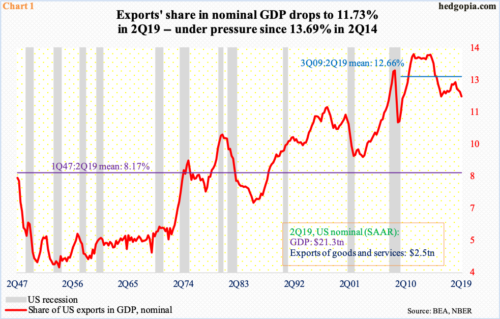
In 2Q19, nominal US exports of goods and services inched down sequentially to a seasonally adjusted annual rate of $2.5 trillion. The all-time high of $2.54 trillion was reached in 2Q18. Exports’ share in nominal GDP came in at 11.7 percent in 2Q19, which is high historically. Going all the way back to 1Q47, the average is 8.2 percent.
Back in 1Q54, exports made up as low as 3.7 percent, before trending higher. The record high of 13.7 percent was recorded in 2Q14. From that high, it is down two percentage points – now below the post-Great Recession average of 12.7 percent (Chart 1). For a while now, the trend has been down.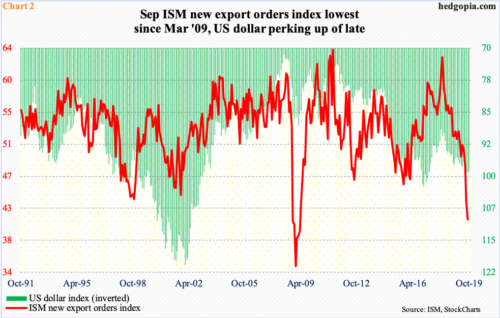
Global trade is sluggish. Major exports powerhouses such as Germany, Japan, South Korea and China have taken it on the chin. Tuesday, the World Trade Organization cut global trade growth forecasts for 2019 to 1.2 percent from the 2.6 percent expected in April. US-China trade tensions have taken a toll on the global economy.
US exports have also been a victim of a strong dollar. The US dollar index formed a base for three months just north of 88 before beginning to rally in April last year. Between the low of February last year and Tuesday’s high, it rallied just under 13 percent. In the currency land, this is no chump change. This is getting reflected in US exports numbers.
Chart 2 plots the US dollar index with the ISM new export orders index. As the former was getting ready to rally in the early months of last year, the latter was getting ready to peak, with February’s 62.8 an 81-month high. Since that peak, the red line has taken a nose-dive. It dropped 2.3 points month-over-month to 41 in September.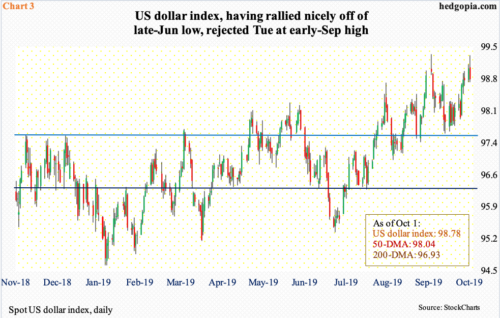
Hence the significance of the US dollar index where it is headed from here.
On September 3, the index tagged 99.33 intraday and reversed lower (Chart 3). The rejection came at the upper bound of a one-year rising channel (Chart 4). Subsequently, bulls defended the 50-day moving average for nearly two weeks before the index pushed higher Wednesday last week. Yesterday, the index came within 0.02 points of the early-September high, but bulls were not able to hang on to the gains.
The daily (98.78) is extended. Unwinding is the path of least resistance near term. The lower bound of the aforementioned channel lies at 96. Well before that at 97.50s rests important horizontal support. The 50-day lies at 98.04 and the daily lower Bollinger band at 97.61. These are levels dollar bulls could be looking to defend.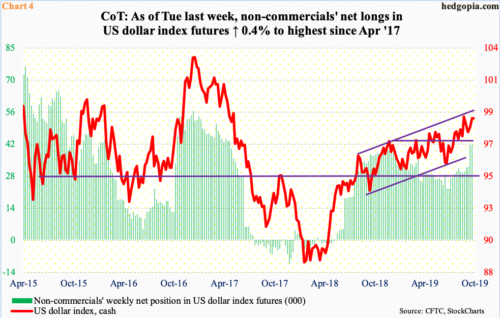
How non-commercials behave in the sessions/weeks ahead at/near support is equally important. Their holdings are worth watching. In Chart 4, the green bars and the red line follow each other.
As of Tuesday last week, non-commercials’ net longs in US dollar index futures inched up 0.4 percent week-over-week to the highest since April 2017; in the prior week, holdings jumped 30.4 percent, which could potentially be a new leg higher, with emphasis on the word ‘potentially’.
As mentioned earlier, the cash began to rally in April last year. That was about the time these traders were getting ready to switch to net long from slightly net short. Since then, they have ridden the rally in the cash perfectly.
If the cash does indeed come under pressure in the sessions/weeks ahead – likely – how non-commercials behave at/near the aforementioned support thus can tell us a lot about where the greenback might be headed, and how US exports might fare.
Thanks for reading!
