
- Otherwise sleepy utilities outrun S&P 500 large-caps by wide margin this year
- Valuations stretched, but XLU’s dividend yields compare favorably to 30-year yields
- With signs of crowded trade, worth waiting on XLU, as path of least resistance lower near-term
Utilities are having a great 2014. And that is an understatement. Year-to-date, the otherwise sleepy sector is up 31 percent, versus nearly (merely?) 13 percent for the S&P 500 large cap index. Even after this year’s rally, XLU, the utilities ETF, is yielding 3.24 percent for the trailing 12 months, higher than what 30-year treasuries are yielding (2.76 percent); that is more than 100 basis points over the 10-year treasury. There you go. That is one allure right there. Dividends probably are not at risk at these protected monopolies. Portfolio managers can sleep better.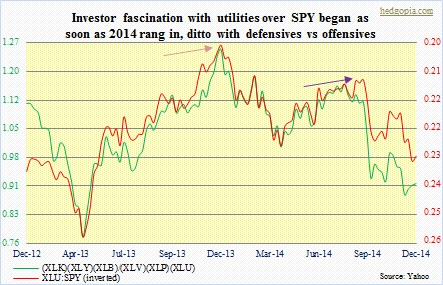
As the chart above shows, utilities started outperforming their large-cap brethren as soon as 2014 began. But a closer look also reveals that it is not just the utilities, rather the whole defensive group. In the chart, a product of healthcare, consumer staples, and utilities is divided into a product of technology, consumer discretionary, and materials. The result is the same. The former began to lead right out of the 2014 gate. This has particularly been the case the past three months.
Is there a message in all this?
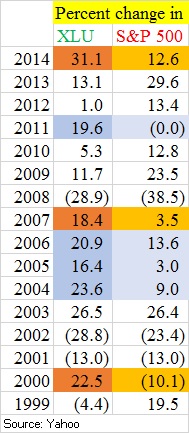 Well, investors gravitating toward safer sectors/stocks is a sign that beneath all the new-highs headlines that we constantly hear in the news and read in the papers, there are jitters. Rather ominously, utilities also led in 2000 and 2007. By a decent margin, as shown in the adjacent table. We know what kind of treatment stocks were meted out in 2001 and 2008, with the S&P 500 down 13 percent and 39 percent, respectively. We are beginning to hear commentators discuss the possibility of stocks in general suffering the same fate in 2015 just because utilities have managed to outperform by such a wide margin this year.
XLU only began trading in 1998, so there is not much data to mine. But the last 15 years have also experienced two of the nastiest bear markets in stocks. And that should provide enough peaks and troughs for our purposes. One more look at the table, and the message begins to get a little blurred. Yes, utilities did indeed lead in 2000 and 2007, with both marking important peaks in stocks. But there have been other years in which the sector led the S&P 500 (2004, 2005, 2006, 2011) but the markets did just fine the following year.
This especially gets tricky as there probably is a whole host of reasons why the sector is outperforming. It is obviously favored by income-seeking investors due to the prevailing low interest rates. People want to stay long stocks, but with “less risk.” And in more ways than one, this has self-fulfilled. Fundamentally, XLU sports a P/E of 19! That is high. Technically, XLU bolted out of a five-year-plus trend channel late October, and the slope has gotten steeper since. It has gone parabolic. Never a good sign.
By the way, the chart below uses only the close. Using weekly open-high-low-close bars gives us a slightly different perspective (not shown here); the ETF has not yet broken out, rather is right underneath the top end of that channel. And that is a yellow flag, as more often than not overbought price tends to get repelled at those levels. There is also less short interest fuel – lowest at least the past seven months. With that said, if the majority of XLU investors are playing it with an interest-rate angle, they likely will not bail unless rates begin to rise in earnest. It is possible.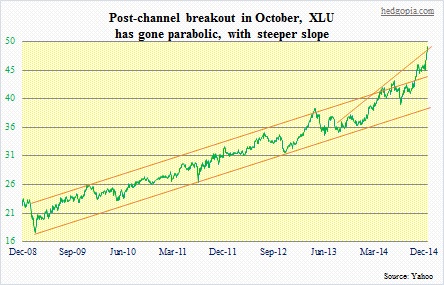
But right now what is increasingly looking probable is this. XLU (48.09) wants to go lower at least in the near-term. This will be a minor test of bulls’ wills.
