A battle is being fought between optimists and pessimists in the land of gold. Of late, the former is winning hands down. Near-term, the latter might at least get some reprieve.
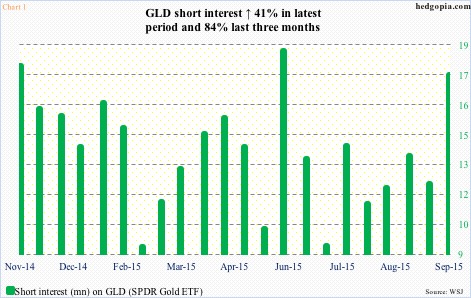
In the latest period (September 30), short interest on GLD, the SPDR Gold ETF, surged 41 percent, to 17.3 million. This is the highest since 17.7 million in the middle of November last year (Chart 1). Back then, the ETF then went on to rally just under 10 percent in a little over two months. By mid-February, short interest shrank to 9.3 million, before rising again. That was a big tailwind for the ETF.
Once again, a similar phenomenon seems to be unfolding. Since September 30 through the intra-day high yesterday, GLD rallied 6.6 percent. It is probable short interest has gone down. The October 15th period will be reported on the 26th.
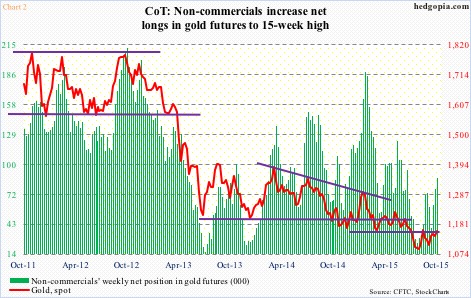
While shorts are getting creamed, non-commercials are relishing it. Chart 2 shows how they have been adding to net longs in gold futures. The metal’s price shown in the chart is as of last Friday, and non-commercials’ holdings as of last Tuesday. When this week’s numbers come out later today, numbers might look different for sure, but the thing to keep in mind is the rising trend in the green bars.
In the past three weeks, non-commercials’ holdings went up from 39,547 contracts to 86,819, to a 15-week high. Incidentally, the red line and the green bars in Chart 2 have shown a tendency to move in tandem.
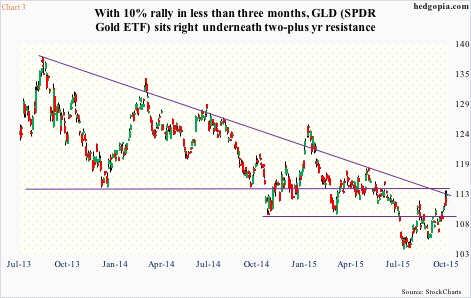
Last week, spot gold closed at $1,155.6, just above resistance at $1,140ish. The corresponding resistance on GLD lied around $110. Through Thursday this week, with a 2.2 percent rally, the ETF closed right underneath another major resistance – at $114.50 – which goes back to June last year. On spot gold, this level approximates $1,180ish; Thursday, it closed at $1,183.
The question is, is there another breakout in the making? Which, if materializes, would also have he ETF break out of a two-plus year declining trend line (Chart 3).
There has been improvement in GLD’s price action. No doubt. Recent downward pressure on the dollar has helped. As has downward pressure on interest rates. The Fed continues to dither on the decision to raise rates. Economic data are just not cooperating with a rate-hike scenario.
In the first two sessions this week, GLD was already up 0.9 percent. Then it shot up 1.7 percent on Wednesday, responding to lousy U.S. retail sales number for September, as well as producer prices that fell 0.5 percent that month. In the process, the ETF sliced through its 200-day moving average on the upside – its first daily close above that average since May. Except for the 200-DMA, which is now flattish, most other averages have turned up. Gold has a lot going for it. The price reflects that.
With that said, the latest upswing has put the metal/GLD right at/underneath the afore-mentioned resistance. Daily technicals are beginning to look stretched. The Wednesday action probably took down lots of stops. On Thursday, there were some early signs of distribution.
If gold wants to rest, this is as good a time as any for it to do so – either just go sideways and correct through time or go down and find new buyers near support. Near-term, the risk to this scenario is this. Next Thursday, the ECB meets, and could potentially give the metal further boost if it announces expansion of its stimulus program. It is possible, not probable. The euro probably needs to rally a lot more before that happens.
Assuming the afore-mentioned resistance holds near-term, a hypothetical trade can be constructed using options – just with a view to generating income. Weekly October 30th 115 calls bring $0.98. It is a naked call, so can be risky, but the ETF ($113.29) has to rally 1.5 percent in the next six sessions. Should that happen, it is a short at $115.98. If the option is called away, and GLD rallies 2.4 percent by expiration, the trade would begin to bleed. But by that time, it would have broken out technically, and will require other strategies to repair the damage.
Thanks for reading!

