
Have foreigners ceased to be a factor in the market for both U.S. equities and treasury securities?
Makes you wonder looking at the Treasury International Capital System data.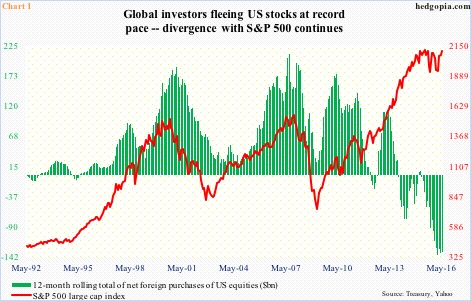
May’s numbers were released this Monday, and there was not much change in the existing trend. Foreigners sold $8.3 billion in U.S. equities – fourth straight negative month. In the last 15 months, only 3 have seen net purchases. On a 12-month rolling total basis, May was negative $134.1 billion. The record was set in February this year, when $138.9 billion worth of equities was sold off (Chart 1).
Historically, net foreign purchases of U.S. equities and the S&P 500 large cap index have shown a tendency to move in lockstep (Chart 1). That correlation ended in the early months of 2013, with the green line peaking at $111.3 billion in April, even as the red line continued higher. The gap has only widened since.
This phenomenon is also at work in the sovereign bond market.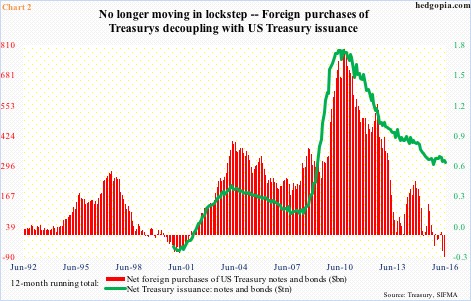
The green line and the red bars in Chart 2 historically have followed each other well, but the correlation has now been broken. Using a 12-month rolling total basis, for instance, issuance of Treasury notes and bonds totaled $1.7 trillion in May 2010, $740.7 billion of which was snapped up by foreigners.
Gradually, as is the case with equities, the correlation between the two began to weaken in the early months of 2013. This past May, issuance of notes and bonds totaled $617 billion, even as foreigners sold $136.8 billion in notes and bonds (Chart 2). The latter – such a reliable source till not too long ago – are no longer buying. They sold in both April and May.
Ironically, this has not mattered much – to both equities and bonds.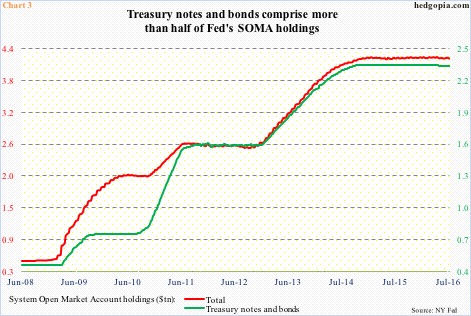
The S&P 500 index and Dow industrials last Friday broke out to new highs, and TLT, the iShares 20+ year treasury bond ETF, surged to an all-time high only eight sessions ago. The 10-year yield tumbled to an all-time low of 1.34 percent on July 6th.
During three iterations of quantitative easing (QE), the Fed was a natural buyer of Treasurys. QE1 began on November 2008. QE3 ended in October 2014. System Open Market Account holdings rose from less than $500 billion in the latter months of 2008 to $4.2 trillion now. Of this, Treasury notes and bonds grew from just north of $400 billion to $2.3 trillion. This must have offset the gradually decreasing role of foreigners in Treasurys.
On the equity side, corporate buybacks possibly played a role.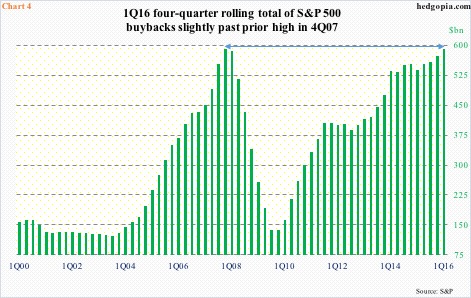
As pointed out earlier, the correlation between the S&P 500 index and foreign purchases of U.S. equities began to weaken in the early months of 2013. That was about the time corporate buybacks shifted into a higher gear (black arrow in Chart 4). In 1Q16, the four-quarter rolling average totaled $589.4 billion, slightly past prior high $589.1 billion in 4Q07.
That said, buybacks were also strong leading up to the 2007 peak (in both buybacks and stocks). The red line and the green bars in Chart 1 began diverging only in the early months of 2013. During all this, NYSE margin debt offset some of the shortfall – having risen from $384.4 billion in April 2013 to an all-time high $507.2 billion two years later (May this year was $451.1 billion). Money-market funds were not much help – $2.59 trillion in April 2013 to $2.72 trillion last week.
Makes you wonder, what is neutralizing the lack of foreign buying in U.S. stocks the past three years?
Thanks for reading!
