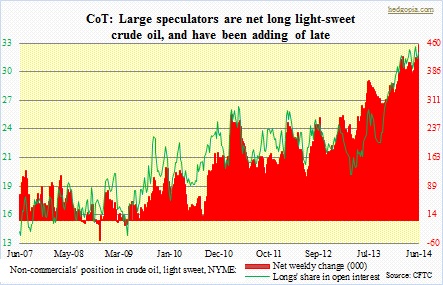
 Crude oil is on the move. Since early April to last week’s high, the Brent has gone up by over 11 percent. The West Texas Intermediate found a trough much earlier – early this year – and until the high eight sessions ago had increased by 18 percent. Similarly, among other refined products, the price of gasoline unleaded has gone up by over 20 percent in five months, and heating oil by over eight percent this month alone. Action is heating up in the futures market. In the latest week, large speculators were net long 457k contracts in light-sweet crude oil (NYME), a full 100k contracts more than since the beginning of the year. The last seven weeks have seen them progressively increase longs as well as cut shorts. Non-commercial longs’ share of open interest has trended up for over a year now from 20 percent in April last year to just under 32 percent now. Directionally, these traders have been spot-on.
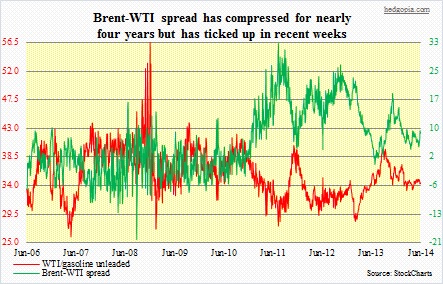
 Since finding a bottom around $35/barrel early 2009, the WTI has progressively made higher highs. Around the same time – late 2008 – the Brent made a low of just over $36/barrel, and has traced out a similar pattern technically as the WTI. Of course, the Brent-WTI spread has been vacillating – from flat in mid-July last year to $19 in late-November to below $9 now. Nevertheless, technically both boast a three-year triangle formation and are currently either just past or right underneath the upper end of the channel. On a longer-term chart, there is room for upside, though on a mid- to short-term basis technicals look grossly overbought. A breakout here will be significant. More recently, since April last year the WTI has gone from $86/barrel to $106 now and the Brent from $97 to $114. In the intervening period, non-commercials rightly raised their longs by 175k and cut shorts by over 30k.
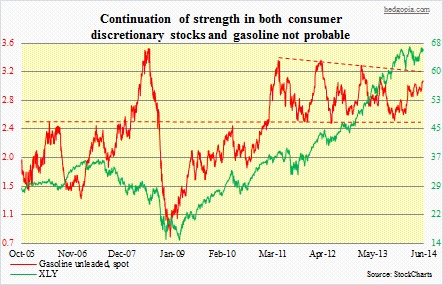
 Should there be a breakout on a longer-term chart, what could be the trigger? Energy trades on a geo-political outlook. The big story currently has been the escalating conflict in Iraq. The fear is that the insurgent Islamist group, ISIS, continues to make advances, raising the possibility that Iraqi oil production continues to decline. The U.S. is not as reliant on Middle East oil as in the past. As a matter of fact, thanks to the shale energy revolution, it now exports more petroleum products than imports. So is the U.S. immune from potential turmoil in that region? Maybe less so than in the past, but not entirely. Far from it. Oil’s implications reach far beyond the energy market. The relationship between crude and gasoline is tight. Normally, the price of crude comprises about 70 percent of the price of gasoline, while the rest is made up of costs related to refinery/distribution, corporate profits, and taxes. Higher gasoline price amounts to indirect tax on consumer pocket book.
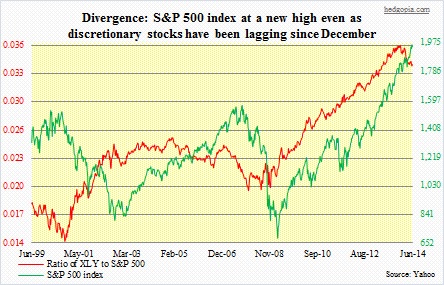
 The question then is, does the Iraqi situation has the potential to linger on? Ideally, the hope is that Nouri al-Maliki, a Shia and currently in his second term as Iraqi prime minister, agrees to leave on his own, or Iran agrees to his exit/is forced out, and the new government is able to give more voice to the alienated Sunni minority as well as the Kurds. Maliki’s coalition, however, won a plurality in the April 30 elections, and has no reason – at least not now – to give in to pressures. In all probability, he would like to hang on to power. In this scenario, if crude indeed breaks out, and gasoline follows, that is bound to have an impact on offensive sectors, including discretionary stocks. The accompanying chart vividly shows one of the several divergences currently present in U.S. equities. Discretionary stocks, represented by XLY, have been clearly lagging from the get-go this year, even as the S&P 500 has notched one after another all-time high. In the near-term, regardless there is a political solution in Iraq or not, it is looking safe to go short XLY around $67. Selling July 14 66 calls for $1 each would also either have us effectively go short at $67 or at least earn premium.

