
Appreciation in US home prices – or a lack thereof – tends to impact consumer psyche. Currently, prices are not that far away from record levels, but the rate of growth is in deceleration. If the trend persists, this has the potential to impact consumer sentiment/spending.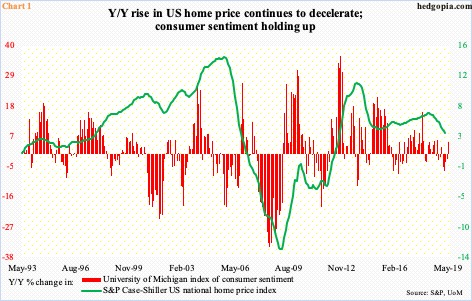
Price appreciation in US homes continues to decelerate.
The S&P Case-Shiller US national home price index rose 3.7 percent year-over-year in March. This is still faster than the rate at which consumer inflation is rising but the rate of appreciation has softened quite a bit. (Depending on what metric we use, inflation is averaging an annual growth rate of two percent or lower.) As recently as March last year, home prices were rising at a 6.5 percent clip (Chart 1). Since then, they have dropped every month.
Perhaps not too surprisingly, the top 10 or 20 cities are bearing the brunt of this deceleration. In March, the 10- and 20-city composite indices respectively rose 2.3 percent and 2.7 percent y/y. A year ago, they peaked at 6.4 percent and 6.7 percent, in that order (not shown here).
The longer this trend persists, the higher the odds of an adverse impact on consumer sentiment. The latter for now is holding up – even diverging. In fact, preliminarily, sentiment in May jumped 5.2 points month-over-month to 102.4. This was the highest since January 2004. (May’s final number is due out Friday.)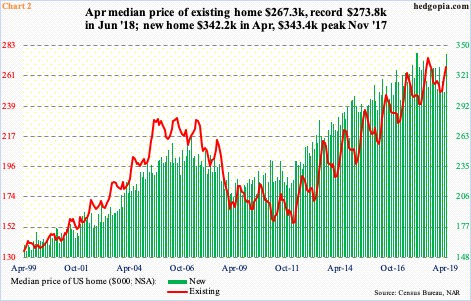
It is also possible home prices firmed up as well in April and May, hence the rather elevated consumer sentiment. The S&P home price index is published with a lag. Other data show home prices held up.
In the 12 months to April, the median price of both an existing and new home rose – up 3.6 percent and 8.8 percent respectively to $267,300 and $342,200. These prices are not that far away from their respective peaks. Existing peaked last June at $273,800 and new in November 2017 at $343,400.
Here is the thing.
Existing in particular shows a tendency to peak in June-July. For nearly eight years now, the red line in Chart 2 has shown a pattern of higher lows, higher highs. The upward trend is also evident in the green bars. In existing in particular, should the pattern remain intact, prices would have risen to a new high in June-July. Last year, as mentioned earlier, June was a record, followed by $269,300 in July. A break in this pattern, however, probably suggests the deceleration message coming from the S&P home price index has staying power. If so, this sooner or later reverberates through consumer sentiment, and in due course, consumer spending.
Thanks for reading!
