
Among U.S. corporates last year, issuance of high-yield bonds fell for the second straight year, to $261 billion. The peak was reached in 2013 at $334 billion, followed by $311 billion in 2014 (Chart 1).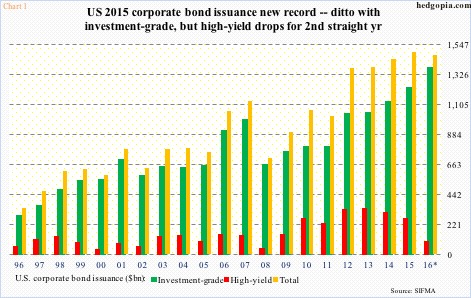
Investment-grade as well as total corporate bond issuance in the meantime went on to post new highs in both 2014 and 2015. Investment-grade rose to $1.23 trillion from $1.13 trillion in 2014, and total issuance to $1.49 trillion from $1.44 trillion in 2014.
Year-to-date, only January is out, so annualizing it may not properly reflect what is to come in the rest of the year. Nonetheless, if the January pace holds up, 2016 is on course to being the first down year since 2011.
This is a phenomenon also witnessed in the prior two credit cycles.
Back in 1998, high-yield peaked at $130 billion, then dropping to $34 billion by 2000. Total issuance peaked in 1999. Then in 2006, high-yield peaked at $147 billion, dropping to $43 billion by 2008. Once again, total issuance peaked a year after the peak in high-yield.
As stated earlier, this time around, high-yield peaked in 2013. If January is any indication, corporate bond issuance is due to drop this year.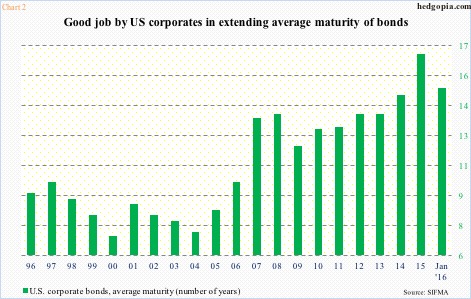
Regardless how 2016 turns out, this cycle has been like no other. Cumulatively between 2009 and 2015, U.S. corporates already issued $8.7 trillion in new bonds. Despite this humongous amount, corporate treasurers should be credited for having persistently extended the average maturity of bonds (Chart 2). At 16.9 years, 2015 was a new high. Even within 2015, September was 20.4 years.
The maturity extension means corporations have taken advantage of the prevailing low interest rates. But the fact remains that on an absolute basis they have issued tons of debt in the current cycle.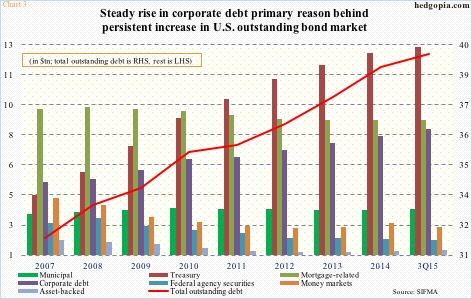
Chart 3 plots the outstanding U.S. bond market debt since 2007. Much ink has been spilled over how the current credit cycle has been characterized by deleveraging. Data does not support this claim. The U.S. bond market has gone up from $31.7 trillion in 2007 to $39.6 trillion in 3Q15. Of the seven categories in the chart, growth is particularly noticeable in Treasury and corporate debt.
U.S. corporate debt in particular has gone from $5.3 trillion in 2007 to $8.2 trillion in 3Q15.
Throughout the cycle, corporate capX has remained subdued. In contrast, dividends and buybacks have remained very healthy. In 3Q15, as-reported earnings of S&P 500 companies were $204.58 billion, dividends were $95.07 billion and buybacks $150.58 billion. In essence, dividends and buybacks made up 120.1 percent of the earnings. Clearly not sustainable in the long run.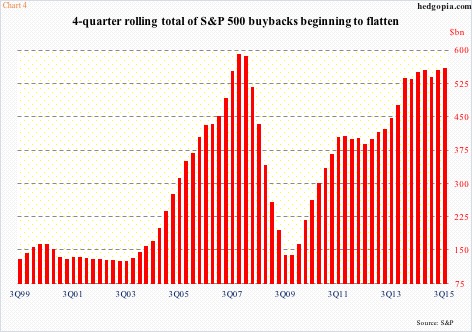
In fact, 3Q15 was the fourth straight quarter in which dividends and buybacks together were in excess of earnings. This is taking place even as earnings have been decelerating since 3Q14. Dividends are still growing healthy, but buyback momentum is slowing down. As of 3Q15, the four-quarter rolling total of S&P 500 buybacks was stuck in the $550-billion range for five straight quarters (Chart 4).
The deceleration in buyback momentum gets no help should momentum in corporate debt issuance begins to slow down. This will have implications for stocks.
Thanks for reading!
