
Since China devalued its currency on August 11, there has been a lot of speculation as to if it has been selling U.S. Treasuries in order to defend the yuan. With the economy having slowed down and the Shanghai Composite Index nearly 40 percent below the June high, China is probably witnessing capital flight.
We would not know for another month whether or not post-devaluation China has been selling Treasuries. The Treasury posted July’s numbers on Wednesday. Pre-devaluation, however, China did reduce its holdings – down $30 billion month-over-month to $1.24 trillion in July.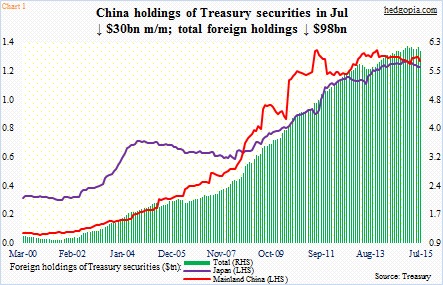
In a larger scheme of things, the July drop is minuscule. China is still the largest foreign holder of these securities. But it is the trend that counts. The past four years, its holdings have more or less gone sideways. Most recently, they peaked at $1.317 trillion in November 2013, pretty close to the prior high of $1.315 trillion in July 2011 (Chart 1). Japan, the second largest holder, was at $1.2 trillion in July, down from the November 2014 peak of $1.24 trillion.
Not surprisingly, total foreign holdings of Treasury securities have been under slight pressure since they peaked in January at $6.22 trillion; July was $6.08 trillion. On a 12-month running total basis, net foreign purchases of Treasury bonds and notes have come under slight pressure – from $233.1 billion last September to $101.8 billion in July, but they are still positive (not shown here). This is unlike what is taking place on the equity side.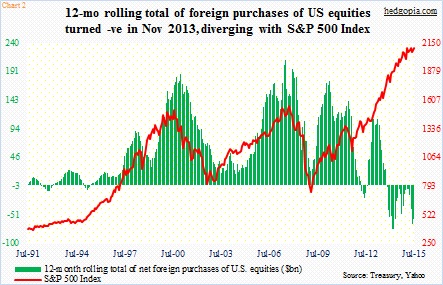
The 12-month rolling total of foreign purchases of U.S. equities turned negative in November 2013, and has stayed that way since. July was -$59 billion (Chart 2). Incidentally, the red line tends to correlate well with the green bars, but has diverged the last two years or so.
The question is, when it comes to foreign demand, what are the odds of Treasury bonds and notes meeting the same fate as have U.S. equities?
Here is the good thing. Despite what is going on with the oil price, major oil-exporting nations have not been selling their Treasuries. In July, the ‘oil exporters’ category held $298 billion – an all-time high. Russia was at $82 billion – a six-month high – though it has been cutting for a while. Mexico was at $86 billion – not too far away from the April high of $87 billion. Canada was at $69 billion, down from $74 billion in March this year. And last but not the least, Norway was at $67 billion, versus the most recent high of $82 billion last December.
As things stand now, China poses a risk. Hence the significance of August’s holdings, when they are reported. Unless it is willing to let the yuan depreciate another 10 to 15 percent, odds are growing that the path of least resistance for China’s Treasury holdings is down for the moment. Needless to say, the nation has been a reliable buyer of Treasuries (just look at where the red line in Chart 1 stood 15 years ago), recycling all those export dollars.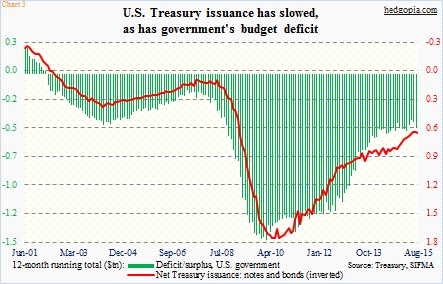
Here at home, over the years, Treasury issuance has been down, but is still sizable. On a 12-month rolling total basis, $628 billion in notes and bonds was issued in August, which is huge nonetheless down from $1.7 trillion in June 2010. This is in line with the drop in the U.S. budget deficit, which again on a 12-month rolling total basis was -$488 billion in July, versus -$1.48 trillion in February 2010 (Chart 3).
The deficit picture has improved, but is not going away. Risk rises if the economy weakens further. A rise in the green bars in Chart 3 will obviously put upward pressure on the red line in the same chart. Hence the importance of the red line in Chart 1. Should it come under pressure, this would be occurring exactly at a potentially wrong time.
Thanks for reading!
