Major US equity indices are a stone’s throw away from record highs. They have done so without much help from foreigners and margin debt. Bulls deserve kudos, but then again, how long can this go on?
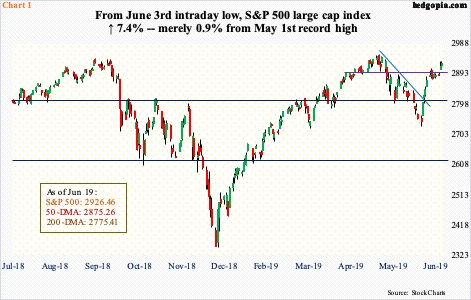
US indices are within striking distance of record highs. They have had quite a rally since bottoming early this month. From the intraday low on June 3 through Wednesday’s high, the S&P 500 large cap index rallied 7.4 percent (Chart 1). That is in 13 sessions!
After rallying past the 50-day eight sessions ago, the index stalled for six sessions just above the average, followed by a mini-breakout Tuesday.
Once again, trader hopes are rising for a trade deal between the US and China as Presidents Donald Trump and Xi Jinping meet at the G20 meeting slated for June 28-29. Wednesday, the Fed kept the fed funds rate unchanged at 225 to 250 basis points, but opened the door for possible easing. Across the Atlantic, Mario Draghi, ECB president, Tuesday said if inflation failed to pick up, more policy easing could be on the way. Traders are salivating over injection of more central-bank liquidity. The S&P 500 is merely 0.9 percent from a new high.
Thus far, equities have completely tuned out the message coming from the bond market. Wednesday, the day the FOMC meeting concluded, the 10-year Treasury yield dropped three basis points to 2.03 percent, briefly breaching the low of September 2017. The spread between 10-year notes and three-month bills remains inverted.
From this perspective, equity bulls deserve credit, particularly so as two major sources of tailwind have turned tail.
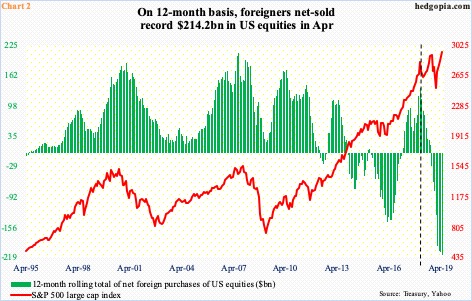
Foreigners continue to cut back exposure to US stocks. In April, they sold $964 million worth. This is quite a progress considering March sales were $23.6 billion. That said, in the 12 months to April, they sold $214.2 billion worth – a new record. In April, the S&P 500 jumped 3.9 percent to a new closing high.
Foreigners refuse to jump on the bullish bandwagon. They have acted that way for a while now. In January-February last year, when US stocks suffered a quick double-digit correction, their net purchases peaked at $135.6 billion (dashed vertical line in Chart 2). The S&P 500 since has gone back and forth, but the green bars kept falling, dipping into negative territory last September.
Similar dynamics are at work in margin debt.
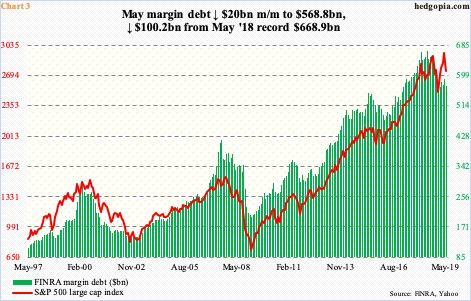
FINRA margin debt in May dropped $20 billion month-over-month to $568.8 billion. The S&P 500 collapsed 6.6 percent in that month. The contraction in margin debt thus makes sense. Nonetheless, it peaked as far back as May last year at $668.9 billion (Chart 3). Historically, the two track each other well. Currently, they have diverged, which is also the case with Chart 2.
Despite this, indices near record highs speaks volumes about how tenacious bulls have been. At the same time, the question is, why are foreigners not getting tempted and/or why are bulls not willing to add to margin debt? Better yet, how long can they sustain the momentum without foreigners and margin debt reversing the prevailing trend?
Thanks for reading!

