May was rough for US stocks. The S&P 500 large cap index lost 6.6 percent, the NYSE composite 6.1 percent and the Nasdaq composite 7.9 percent. Things reversed in June and July. Through the intraday low on June 3 through the high of July 15, they respectively rallied 10.6 percent, 8.3 percent and 13.3 percent. At least through the end of June, short squeeze did not contribute much to the rally.
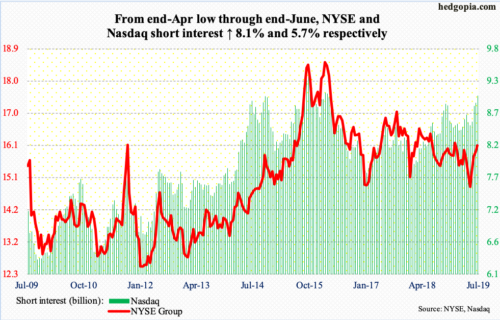
The chart above plots NYSE and Nasdaq short interest going back a decade. The current buildup in Nasdaq’s is particularly noticeable. Most recently, short interest for both bottomed at the end of April. In the next four periods through the end of June, it rose 8.1 percent and 5.7 percent, in that order. Currently, NYSE’s is at a six-month high, while Nasdaq’s is the highest since February 2016.
Both these indices, along with other major equity indices, are under slight pressure, having peaked on July 15. Mid-July short interest is not out until the 24th. So, we will not find out until then if shorts got squeezed in the first half, although the second half has begun better for them. From the mid-month high, the Nasdaq so far is down 0.7 percent and was down as much as 1.6 percent through Thursday’s low. The daily remains overbought, and the weekly is getting there. In the right circumstances for shorts, there is plenty of room for continued pressure.
In this scenario, the high level of short interest could very well end up helping the bulls, as shorts likely get tempted into locking in profit/cutting losses near support. From this respect, the 50-day moving average on the Nasdaq (8207) lies at 7883. Worse, the 200-day is at 7525, with a rising trend line from late December drawing to 7600.
Thanks for reading!

