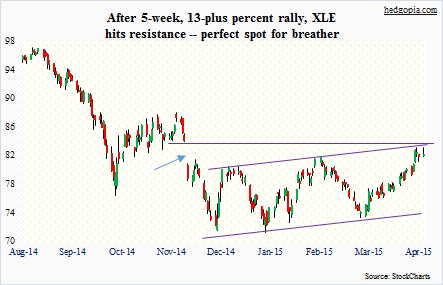
XLE ($82.22), the energy ETF, seems to want to go lower near-term.
Since the mid-January low of $71.22, it has carved out a pattern of higher lows, and higher highs, hence now finds itself in a slightly upward sloping channel. The price just kissed the upper end of that.
This area is also important for other reasons.
Right above lies its 200-day moving average ($84.46). With the recent rally, the ETF has just about filled the late-November gap. Since its March 13th intra-day low through last week’s high, it has rallied north of 13 percent.
Combine all this, and this potentially is as good a place as any for shorts to show up or longs to lock in profit, at least near-term. Daily indicators are grossly overbought.
Some signs are beginning to appear.
Last Thursday produced a spinning top, followed by a shooting star yesterday. The rally was much stronger early yesterday but faded after facing resistance at the upper Bollinger Band.
This probably sets up well to generate some income in weekly options.
XOM makes up 15.7 percent of the ETF, and CVX 13.1 percent. The third largest, SLB (7.2 percent), reported 1Q15 last Friday; the stock reacted well, but was repelled by its 200-day moving average. Ditto with yesterday’s session. SLB has had a great run into the earnings.
XOM reports on April 30th and CVX on May 1st. Both these stocks are acting as if they are itching to go lower near-term, but anything can happen post-earnings. HAL popped two-plus percent yesterday post-earnings.
Hence the reason to go with the weekly (April 24th). It is a simple bear call spread.
Here is a hypothetical structure:
Short 82.50 call for $0.49
Long 84 call for $0.10
It nets a credit of $0.39. Breakeven is $82.89, and $1.11 is at risk. The long call helps limit the upside risk.
Thanks for reading!

