Back on April 23rd, I wrote a piece on U.S. housing for See It Market (reposted here on 24th), arguing the importance of $26, and then $24, on the Home Construction ETF (ITB).
The ETF ($26.32) closed at $27.45 on April 22nd, having lost its 50-day moving average. It continued to remain under pressure for the next several sessions.
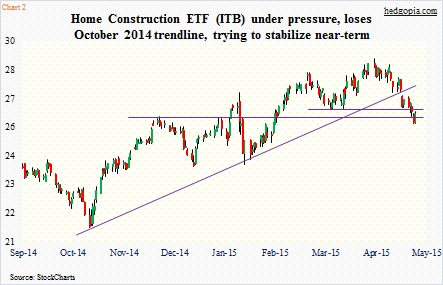
Last week, some signs emerged that it was trying to stabilize. Thursday’s selling stopped near the 150-day moving average (at $25.73). Friday, it rallied some. Daily indicators are now grossly oversold.
A trade could be developing here in the short-term.
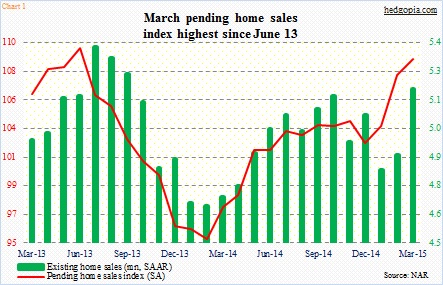
Fundamentally, March sales were mixed – existing homes were strong but new homes weak. The pending home sales index has had a nice uptick since December (Chart 1). This week, the only housing-related data on schedule is mortgage applications (Wednesday); it comes out every week. No major homebuilder will be announcing earnings. From the perspective of news, it potentially is a safe week.
Having said that, in the intermediate-term, it is probably premature to bet that ITB selling is over. It has lost the October 2014 trendline (Chart 2). Moving averages – from 10- to 20- to 50-day – have turned lower. Weekly momentum indicators are under pressure, with some of them approaching the middle of the range; at times, selling can stop right here, other times, downward momentum can continue.
Not knowing which way it is going to go and given the oversold conditions near-term, short puts can be used to generate some income.
Weekly (May 8th) 26.50 ITB puts are selling for $0.45. If the ETF cannot rally, then it turns into an effective long at $26.05. If by Friday it rallies 0.7 percent, premium is kept.
Thanks for taking the time to read this post.

