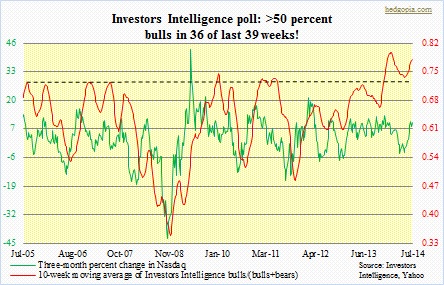
 Newsletter writers continue to defy gravity, yet have so far been on the right side of trade. The latest edition of the Investors Intelligence survey shows bulls at 56.5 percent, essentially unchanged week-over-week. Except for three weeks in February in which readings were in the 40s, bulls have had readings in the 50s for the 39th consecutive week, five of whom had >60 percent bulls! These are mind-numbing numbers – enough to generate a contrarian caution signal. In the past, it has paid to be cautious as soon as the 10-week moving average of bulls/bulls+bears got to the low .70s. This took place in the middle of November last year. Back then, the Nasdaq was under 3900, and has since added 600 points. Ever since, the said II average has stayed in the .70s, and even hit .80 twice. These are extreme readings, but are yet to correct. This is also true with the overall stock market (the S&P 500 Index has not had a five-percent correction for six months now), and this bullish investor sentiment is feeding into the II poll. As the accompanying chart shows, the three-month percent change in the Nasdaq has tended to lead the 10-week average by a month or two. Makes sense in that in a momentum-driven market strength begets strength. Most recently, the index bottomed mid-April and until the high early this month had rallied 14 percent in three short months. Mid-April in the II poll, bulls stood at 50.5 percent; their ranks then began to rise, staying in the 50s and 60s ever since. Hard to tell if it is the tail wagging the dog or the dog wagging the tail. What is certain is this: the longer this metric stays as complacent as it is, the higher the odds of a vicious corrective phase to follow.

