The top two holders of Treasury securities have been cutting back their holdings. In August, China and Japan respectively held $1.19 trillion and $1.14 trillion. China’s peaked at $1.32 trillion in November 2013 and Japan’s at $1.24 trillion a year later.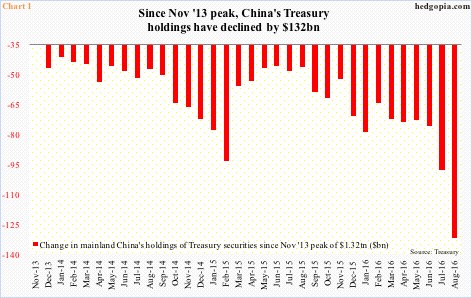
In August, China sold a whopping $33.7 billion worth – the largest monthly drop since December 2013 when holdings fell by $46.6 billion. The August drop came on the heels of a $22-billion reduction in July.
As noted above, China has been cutting back for a while. Since the November 2013 all-time high, it has sold nearly $132 billion worth (Chart 1). Its current holdings are the lowest since November 2012.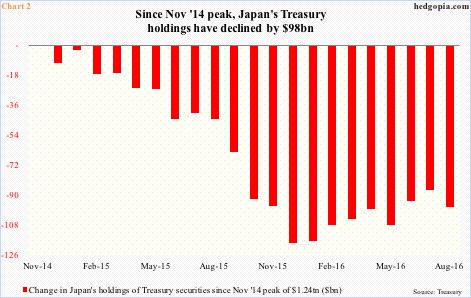
Japan is not as extreme, but comes close. Since the November 2014 peak, it has sold nearly $98 billion worth. In August, holdings fell by $10.6 billion, and have inched higher since $1.12 trillion last December (Chart 2).
At one time, Japan was the largest holder of Treasury securities. In March 2000, China held $71 billion and Japan $308 billion. September 2008 was the first time the two tied at $618 billion. Then China rapidly pulled ahead. Coincidentally, this is when the Fed began its ultra-loose monetary policy including quantitative easing. By July 2011, China was holding as much as $430 billion more than Japan did. Now they are essentially tied, with China aggressively cutting back. But why?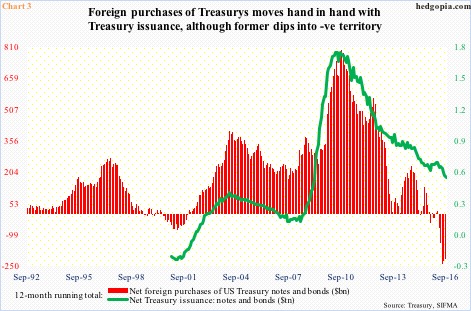
The Treasury has been issuing fewer notes and bonds. On a 12-month rolling total basis, net issuance was $507 billion in September, down $24 billion over August. In fact, issuance has been trending down since peaking at $1.7 trillion in May 2010 (Chart 3). In September of that year, foreigners’ purchases of Treasury notes and bonds peaked at $793 billion, before heading lower.
In Chart 3, the two variables tend to track each other, except the red bars dipped into negative territory last October. Because Treasury issuance has declined, the selling by China and Japan has not mattered. Here is the rub.
Both U.S. presidential candidates have been talking about fiscal stimulus. So before long the green line in Chart 3 can reverse higher. If and when that happens, those two nations need to step up, or its impact will be felt in interest rates.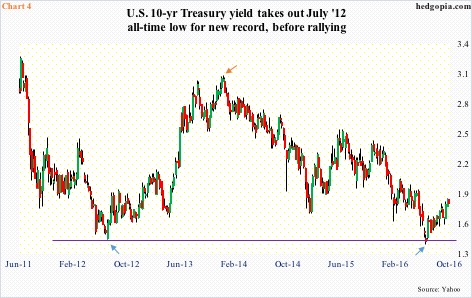
The bond market has been in a bull market for God knows how long. The 10-year yield peaked at 15.8 percent in September 1981. A multi-year – even multi-decade – bull market in bonds was set in motion. The yield bottomed at 1.39 percent in July 2012, which this July was briefly breached – dropping to 1.34 percent (blue arrows in Chart 4).
It is not out of the ordinary for longs to be wanting to lock in profit, regardless how big a holder they are or their motive of ownership. Shortly after China began to cut back holdings in November 2013 (orange arrow in Chart 4), the 10-year yield peaked just north of three percent, and has not been back there since.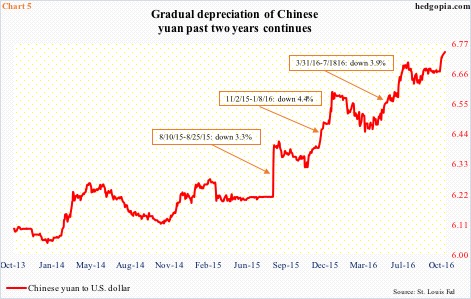
As far as China is concerned, a cogent argument can be made that it is having to cut back its Treasury holdings to raise funds for other purposes.
Back in January 1981, a dollar bought 1.55 in Chinese yuan. By April 1994, the Chinese currency had depreciated to 8.73/$. Then by January 2014, it appreciated to 6.05, before beginning a new cycle of weakness. Note that China’s Treasury holdings peaked in November 2013.
On August 11, 2015, markets globally were shocked when the People’s Bank of China devalued the yuan by 1.8 percent. Bloomberg put the amount of money leaving China in that month at nearly $142 billion. To defend the yuan from weakening in an uncontrolled manner, the PBoC needs to intervene, and for that it needs funds. As is seen in Chart 5, the yuan has continued to depreciate since then.
If this trend persists – not unimaginable especially if the Fed does indeed tighten – and China continues to lighten up its Treasury holdings, this will run in contrast with a scenario in which the next president tries to fiscally stimulate – which may mean larger budget deficit and larger Treasury issuance.
Thanks for reading!

