
Equity bears came up short last week, unable to take benefit of an opportunity to put the bulls on the defensive. Momentum remains with the bulls. With the S&P 500 having already rallied 28 percent from last October’s low, several variables need to act better for this to continue.
Equity bulls put their foot down on time.
Three weeks ago, after rallying in 16 of 18 weeks, a weekly spinning top formed on the S&P 500. This was followed by another weekly candle with a large upper shadow – almost a gravestone doji. This indecisive action offered a slight opening for the bears, who, however, failed to cash in on the chance.
Last week, in a clear sign the bulls are not ready to give up just yet, the large cap index rallied both Monday and Tuesday. Come Wednesday, the FOMC dot plot/Chair Jerome Powell all but solicited risk-on by reiterating their December-meeting outlook for three 25-basis-point cuts this year, and the S&P 500 broke out of short-term resistance at 5170s. By Friday, the week was up 2.3 percent to 5234.
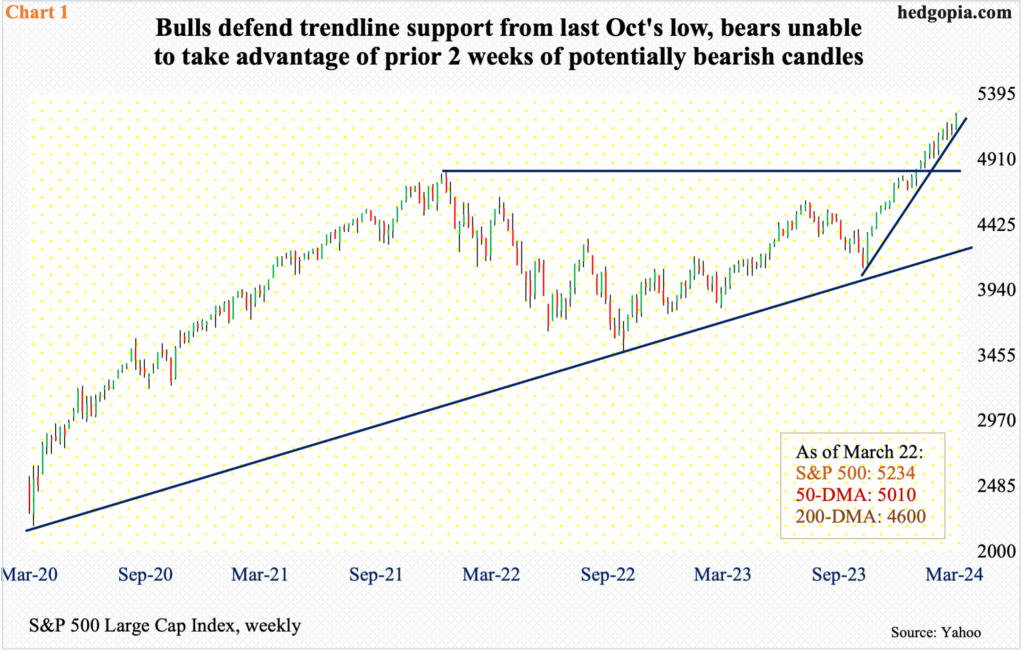
A rising trend line from last October has been defended (Chart 1). The index remains overbought on several timeframes, but momentum is yet to crack, let alone break.
In the event of downward pressure in the sessions ahead, 5170s is the one to watch for near-term direction.
Giving credit where credit is due, it has been right to stay bullish since last October’s bottom. Through last Thursday’s intraday high of 5261, the S&P 500 has added 28.2 percent since that low.
Sentiment is profuse. Over the last 19 weeks, except for one week in mid-November, Investors Intelligence bulls have persistently remained north of 50 percent; of this, two crossed 60 percent.
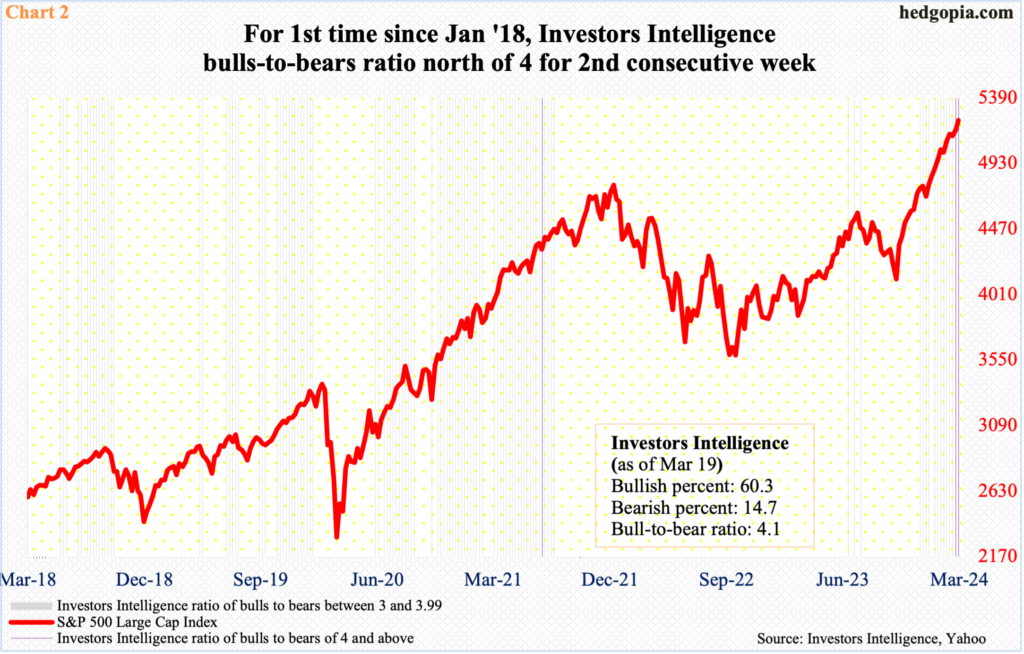
Last week, as of Tuesday, the bullish percent registered 60.3 percent and the bearish 14.7 percent, versus the prior week’s 60.9 percent and 14.5 percent. The March 12th reading was the most bullish since July 2021 and the most bearish since February 2018. Both these weeks produced a bulls-to-bears ratio of four-plus – 4.2 and 4.1 respectively.
Readings of four or higher are rare (Chart 2). One needs to go to January 2018 to find back-to-back readings of four or higher. Back then, the streak ended in late January after 15 weeks of 60-plus readings. Equity bulls would love a repeat of that feat – or even anything remotely close. A lot of things must go right for this to occur.
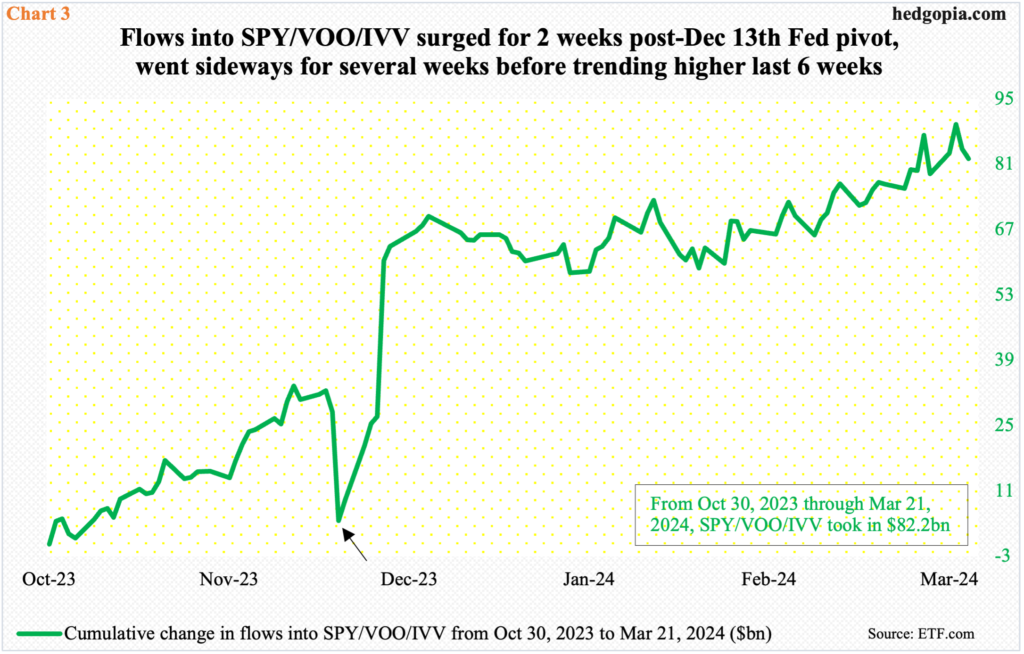
Chart 3 presents cumulative flows into SPY (SPDR S&P 500 ETF), VOO (Vanguard S&P 500 ETF) and IVV (iShares Core S&P 500 ETF) beginning October 30th last year; the S&P 500 bottomed on the 27th. For the first month and a half, flows acted tentative. On the 13th that month, the FOMC made a dovish pivot. Then money came pouring in, went vertical for two weeks (arrow in the chart) before going sideways and then slightly higher.
As of last Thursday, the three ETFs took in $82.2 billion from late October, with the recent peak of $89.6 billion on the 19th. Hopefully for the bulls, the downtick the past couple of sessions is not the beginning of a trend change.
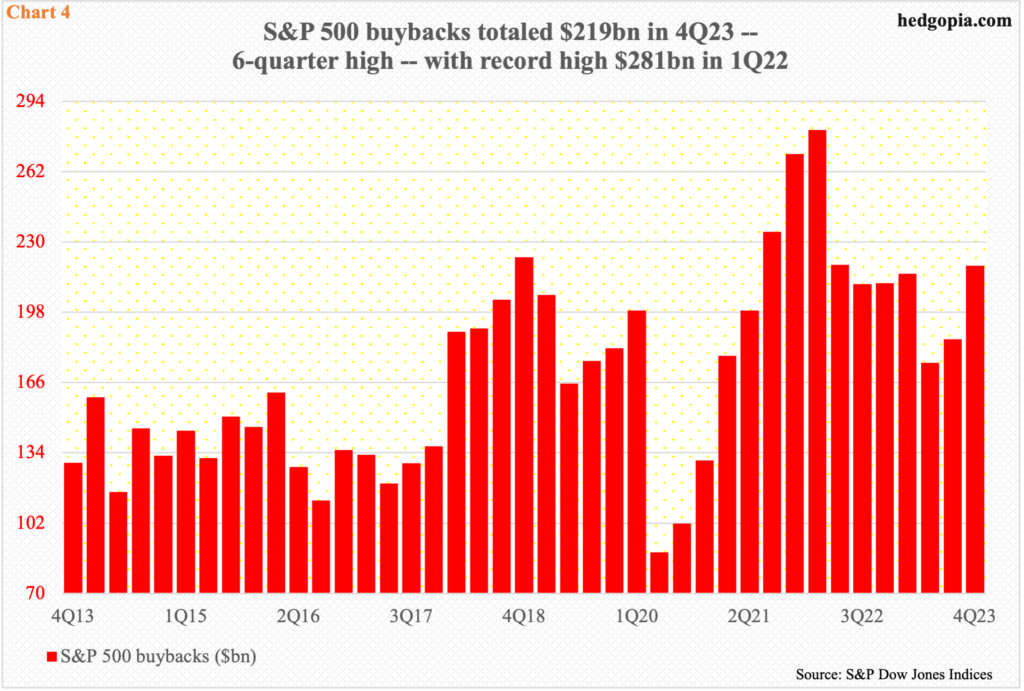
Buybacks, on the other hand, continue to provide a tailwind. In the December quarter, S&P 500 companies spent $219 billion in share buyback, with the four-quarter total rising to $795 billion from $787 billion in the September quarter.
Except for two quarters in the second and third quarters last year, quarterly buybacks have remained north of $200 billion in eight of the last 10 quarters, with the record $281 billion taking place in 1Q22 (Chart 4).

Margin debt, in the meantime, is beginning to go the right direction but could do a lot better.
In October 2021, margin debt set a record at $936 billion. It then tumbled to $607 billion by December 2022; stocks bottomed in October of that year. Last October, stocks once again reached a major trough; as did margin debt, which stood at $635 billion, subsequently rising to $743 billion last month (Chart 5).
Equity bulls hope February’s $41-billion month-over-over jump is the beginning of a new trend, because margin debt needs to grow by $193 billion just to match the October 2021 high. The S&P 500 is at a new high, but not margin debt. A sustained buildup in investor willingness to take on leverage will help. But then again, if the massive rally since last October’s low has not already done that, one wonders what else might.
The bottom line is that not all the variables are in sync. Of the four mentioned above, they all could improve, and need to if the current momentum in equities is to persist, with some like sentiment already extended.
Thanks for reading!
