
After a massive rally in the past three months, the Russell 2000 is tracing out a consolidation pattern. Investor optimism remains very high. For continuation of the uptrend, money-market funds likely hold the key. Barring their cooperation, bulls will have their work cut out.
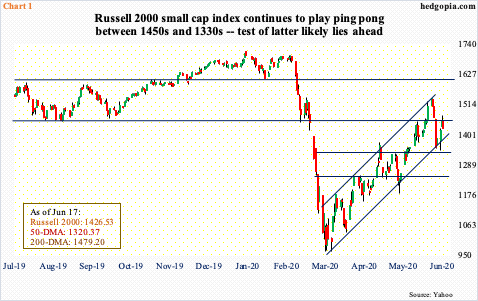
From its March 18th intraday low of 966.22 through the June 8th high of 1537.62, the Russell 2000 small cap index shot up just over 59 percent. This preceded a drop of just north of 43 percent from the February 20th high of 1698.91.
A rally of this size materialized in a little less than three months! This is a massive move, and typically would have been followed by digestion. We could be in the midst of one currently. The index is either consolidating before another leg higher or is in the process of rolling over – again.
The high from June 8th kissed the upper band of a three-month ascending channel, before coming under pressure. Last Friday as well as Monday this week, 1330s was just about tested and it held. The index (1426.53) then quickly catapulted to test 1450s both Tuesday and Wednesday (Chart 1). Both bulls and bears are standing their ground. Immediately ahead, a test of 1330s is the path of least resistance. A breach opens the door to a test of 1250s. Should things evolve this way, the index would have decisively lost the channel in question.
The current consolidation has unfolded even as investor optimism has risen to a multi-week high.
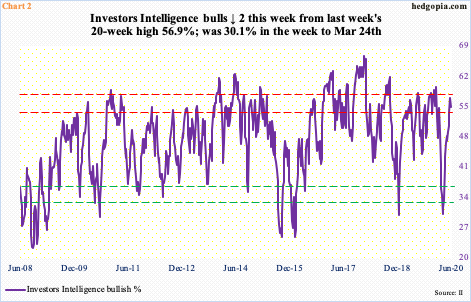
Investors Intelligence bulls this week were down two percentage points from last week’s 56.9 percent, which was the highest since the week to January 21st (Chart 2). Perhaps importantly, bears, too, weakened by two percentage points week-over-week to 18.6 percent. In the week to February 18th – just before the rug was pulled out from underneath stocks – bears were 18.9 percent. That said, they languished in the 17 to 18 percent range for months before major US stock indices peaked in February.
In a best-case scenario for equity bulls, bears could similarly go sideways, even as bulls could strengthen. In the week to January 21st, their count was 59.4 percent. This scenario could indeed come to pass should money-market assets begin to find a home in stocks.
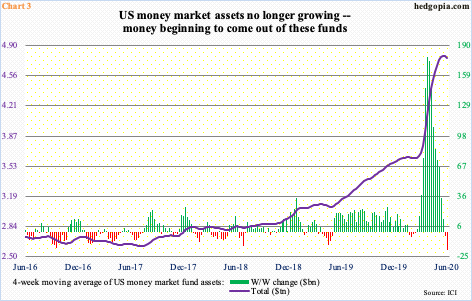
Until recently, these finds kept growing. In fact, ‘went parabolic’ would be the right way to describe how they were behaving. In the week to February 19th, when stocks peaked, money-market funds held $3.63 trillion. In the week to March 25th, when stocks were bottoming, this grew to $4.22 trillion, and kept growing even though stocks were ripping higher. By May 20th, they boasted $4.79 trillion – a record. From that peak until the week to June 10th, they dropped by $71.6 billion to $4.72 trillion. (At the time of writing this, ICI had not yet published data for the week to 17th.)
Chart 3 uses a four-week moving average, and the decelerating trend in the so-called cash-on-the-sidelines is evident. In fact, the first two weeks of June were in the red, which is what equity bulls would like to see, provided stocks get their fair share.
Barring that, bulls will have their work cut out, particularly so as they have spent quite a bit of buying power in rallying the major stock indices in the past three months. From this perspective, how bulls behave when 1330s is tested on the Russell 2000 should be a tell.
Thanks for reading!
