
Gold has had a nice rally since early October, and is extended on both daily and weekly charts. It is also at dual resistance. Near term, recent longs can get tempted to lock in profit.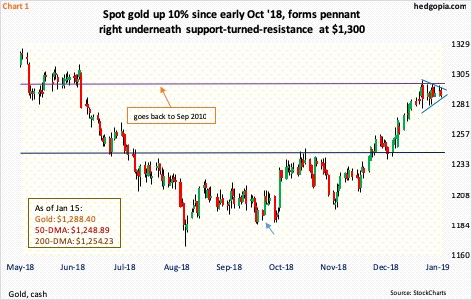
Spot gold ($1,288.40/ounce) looks tired. It has had quite a rally. Mid-August last year, it bottomed at $1,167.10, but went sideways the next month and a half. Early October, the bottom fell out of US stocks, and gold began to attract bids (arrow in Chart 1). From the September 28th intraday low of $1,184.30 through the high of $1,300.40 on January 4, it jumped 9.8 percent. The metal has stalled at an important level.
Back in June last year, gold got rejected at $1,360s and was on its way down, but not before gold bugs doing all they can to save support at $1,300, which goes all the way back to September 2010. Once that support was lost, selling accelerated. The metal is at it again – this time after a decent rally.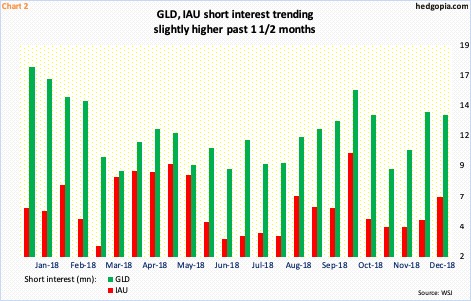
With that said, there is this, though. Year-to-date, gold has essentially gone sideways. A pennant has formed after a three-month run. More often than not, this can be a continuation pattern. Bulls would love a breakout here, followed by a takeout of $1,300. Stops likely get taken out in this scenario. Several times since the metal bottomed in December 2015, it has struggled at $1,360s. Bulls would love to test that resistance again.
But right here and now, there needs to be a massive increase in risk-off sentiment for that to occur. Short interest in gold ETFs has built up in the past month and a half but is not that elevated. At the end of December, short interest on GLD (SPDR gold ETF) fell 1.7 percent from a two-month high 13.4 million in the prior period. On IAU (iShares gold trust), it jumped 42.3 percent period-over-period to 6.4 million – a two-and-a-half-month high (Chart 2).
Barring a genuine breakout, accompanied by a squeeze, gold could very well proceed to digest the recent gains.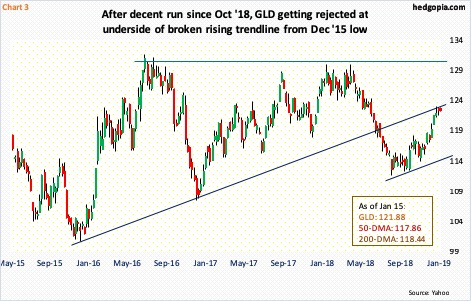
This is particularly so as, besides $1,300 ($122.50 on GLD), the yellow metal currently faces another hurdle.
GLD peaked in September 2011 at $185.85, before coming under sustained pressure. It bottomed in December 2015 at $100.23. Since that low, gold bugs tried to take out $130-$131 several times, but in vain (Chart 3), although the ETF was making higher lows. A rising trend line drawn from that low was breached last July. For three weeks now, GLD has gotten denied at the underside of that trend line.
On the daily, momentum indicators are extended; the MACD just developed a potentially bearish cross-under. Downward pressure can lure particularly the recent longs to lock in gains.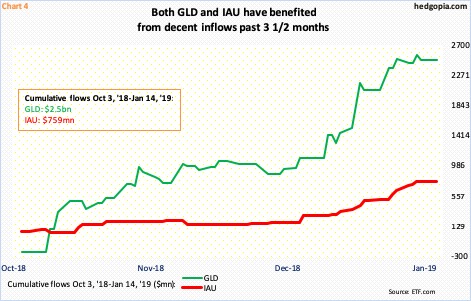
From October 3 last year, when major US equity indices began what soon turned into a waterfall dive, through this Monday, $2.5 billion moved into GLD and another $759 million into IAU. These positive flows obviously helped these ETFs rally. If they begin to lock in gains, it can have the opposite effect. The 200-day moving average lies at $118.44, and the 50-day right below at $117.86. In due course, a golden cross could form, so it is probably not prudent to stay bearish gold medium- to long-term. Tactically, near-term is another matter.
One way to play this is through options. In the February 15th expiration, GLD ($121.88) 122 and 123 calls sell at $1.41 and $1.01 respectively. A hypothetical credit call spread earns $0.40 in premium, with $0.60 at risk. The aim of the short call is to generate income, while the long call limits the upside risk.
Thanks for reading!
