
The S&P 500 rallied to a new high last week. Since January last year, it has more or less treaded water, although there have been higher highs. Several potential sources of tailwind are missing in action. Corporate buybacks are the only saving grace.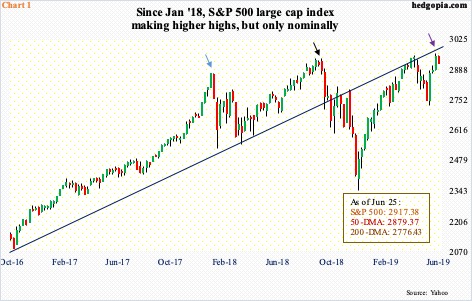
The S&P 500 large cap index (2917.38) just set a new all-time high (indigo arrow in Chart 1). Since the low of last December through last Friday’s intraday high of 2964.15, it jumped 26.3 percent. Despite this, last week’s high was only nominally higher than the prior high of 2940.91 from last September (black arrow). Before that, the index peaked at 2872.87 in January last year (blue arrow).
It is like running on a treadmill. Since January last year, the index has not made a whole lot of progress. Since last October, rally attempts have been resisted at the underside of a broken trend line from November 2016.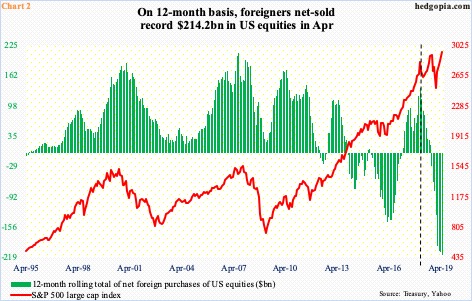
Several potential sources of tailwind have taken a back seat.
Historically, foreign buying – or selling – has tended to move in tandem with the S&P 500. This time around, the two have diverged. Or, maybe not, come to think of it. As stated earlier, the index has more or less treaded water since January last year. That was when the 12-month total of net foreign purchases of US equities peaked at $135.6 billion (vertical dashed line in Chart 2). Since then, the S&P 500 has gone back and forth a lot, but foreigners kept reducing their exposure to US stocks. In April, they sold $214.2 billion worth – a new record.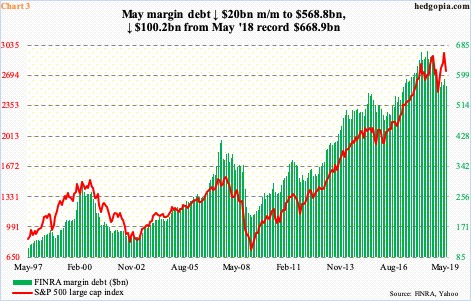
Margin debt is another metric that has turned into a headwind. Shortly after the aforementioned high in the S&P 500 was reached in January last year, FINRA margin debt peaked at $668.9 billion in May. The S&P 500 went on to surpass that high – albeit nominally – but margin debt never followed along. By last December, it fell to $554.3 billion, as stocks took it on the chin for three months beginning October. Stocks recovered, but not margin debt. In May, it fell $20 billion to $568.8 billion, down a whopping $100.2 billion from its record high (Chart 3).
Unlike in the past, new highs in equity indices has failed to lure bulls into adding to leverage.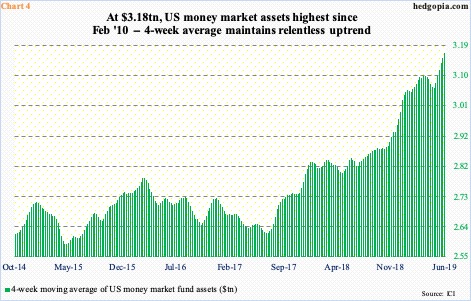
Or, they are just building their cash hoard.
ICI data show US money-market assets are currently at the highest since February 2010. In the latest week (as of Wednesday last week), they rose $12.6 billion week-over-week to $3.18 trillion. Since last December, when stocks bottomed, $145.3 billion went into these funds, essentially turning a blind eye to the massive rally since that low. Thus far, this particular source of buying power has refused to chase the rally.
The relentless uptrend in buildup of these assets is seen in Chart 4, which uses a four-week average.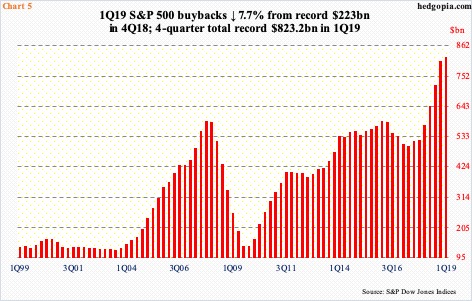
Despite all this, bulls deserve kudos for the way they have hung in there. They owe it to corporate buybacks – big time. One look at Chart 5 and it is easy to see why.
Buybacks by S&P 500 companies fell slightly to $205.8 billion from record $223 billion in 4Q18, but this was the third consecutive quarterly total of $200-billion-plus. Consequently, the four-quarter total surged to $823.2 billion, which is what the chart shows.
Most recently, the red bars bottomed at $500.8 billion in 2Q17, and have risen every quarter since. The tax cuts of December 2017 gave a special push to buybacks, which has essentially offset the lack of buying from other sources, hence its significance. The question is, is the momentum sustainable?
We know this much. Action is heavily top-heavy. S&P Dow Jones Indices points out that in 1Q19 the top 20 accounted for 51.2 percent of total spending. The top-10 list only consists of tech/biotech and financials – Apple (AAPL) $23.8 billion, Oracle (ORCL) $10 billion, Pfizer (PFE) $8.9 billion, Bank of America (BAC) $6.3 billion, Cisco Systems (CSCO) $6.1 billion, JPMorgan Chase (JPM) $5.1 billion, Wells Fargo (WFC) $5.1 billion, Microsoft (MSFT) $4.8 billion, Citigroup (C) $4.4 billion and Eli Lilly (ELY) $3.5 billion.
The reliance on just a few names for a disproportionately large amount is a risk. When the trend reverses – and it will, it is just a matter of when, not if – the hitherto-tailwind can rapidly turn into a headwind. This is particularly so as other sources of buying power do not yet show readiness to pick up the slack.
Thanks for reading!
