Of late, the U.S. dollar has defied expectations.
Since peaking at 103.82 early January last year through Thursday’s intraday low, the US dollar index (89.23) dropped 15 percent. This was a period in which U.S. economic fundamentals have been decent to strong.
In 2017, real GDP grew 3.1 percent in 2Q and 3.2 percent in 3Q. The first print of 4Q will be published later this morning; as of January 25, the Atlanta Fed’s GDPNow model was forecasting 3.4-percent growth. If 4Q prints three percent or higher, this would be the first time since 2Q04-1Q05 of at least three consecutive quarterly growth of three percent or higher.
Yet, the US dollar index cannot get going.
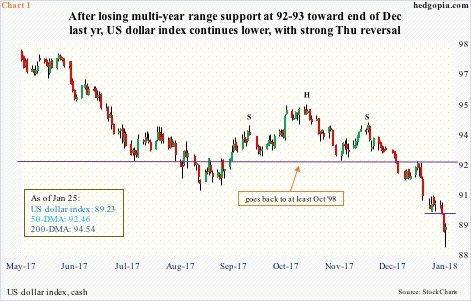
In fact, toward the end of December last year, it lost major technical support between 92 and 93 going back nearly two decades, and continued lower (Chart 1).
The latest excuse to sell came from Davos. Wednesday, Treasury Secretary Steven Mnuchin said a weak dollar was good. Although a day later, President Trump said Mr. Mnuchin’s comments were misinterpreted, which helped the greenback. After dropping all the way to 88.25 intraday, the dollar index rose 0.2 percent in that session.
Support at 89 goes back to early 2004. Thursday’s low also tested a rising trend line from May 2011 – so far successfully.
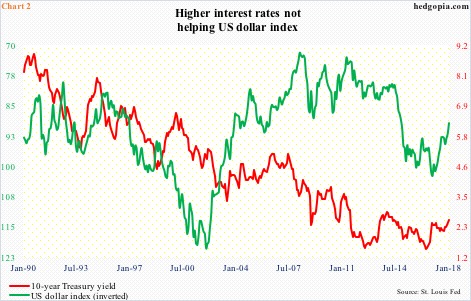
Ironically, the dollar’s decline has come in the midst of rising rates.
Interest rates are just one variable in deciding the fate of a currency, no doubt. Nonetheless, the conventional thinking is that higher rates attract foreign investment, which, in turn, should put upward pressure on the currency in question.
Chart 2 pits the US dollar index, which is inverted, against 10-year Treasury yields. It is not perfect, but there rather seems to be an inverse relationship between the two, including during the most recent backup in yields.
What is the message here from the markets? That a persistent rise in rates will end up hurting the economy, and hence a lower dollar?
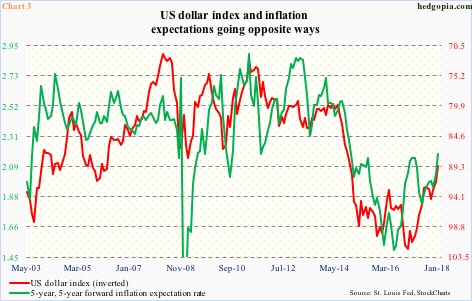
Or is the dollar simply following inflation expectations?
The five-year, five-year forward inflation expectation rate bottomed at 1.5 percent in June 2016. One year later – in June 2017 – it troughed again, at 1.83 percent. Wednesday, it was at 2.18 percent (Chart 3). Not alarming by any stretch of the imagination, but the trend is clearly up, particularly the past few months.
As inflation picks up, the purchasing power of a currency goes down. Typically, countries with higher inflation tend to see their currency depreciate.
In the present context, though, the question is, what kind of cause-and-effect relationship these two have? Is the dollar index responding to higher inflation expectations or is it the other way around? Commodities are rallying, and they are priced in dollars. By corollary, a lower dollar can push up inflation.
The thing is, in the current cycle – for nearly a decade – major central banks have been too active in the markets. Conventional correlation has broken down left and right across asset classes. The dollar, too, could very well be a victim of this, hence the inability of conventional theories to explain its woes.
Thanks for reading!

