
Post-earnings stock reaction to the leading US financials has been negative. Ditto with how INTC and IBM were treated. This week and next, the top six companies report. Amidst elevated investor optimism and surging margin debt, reaction to their results might just be a tell.
The 4Q20 earnings season has just begun. Equity bulls are probably not happy how markets are reacting to the results.
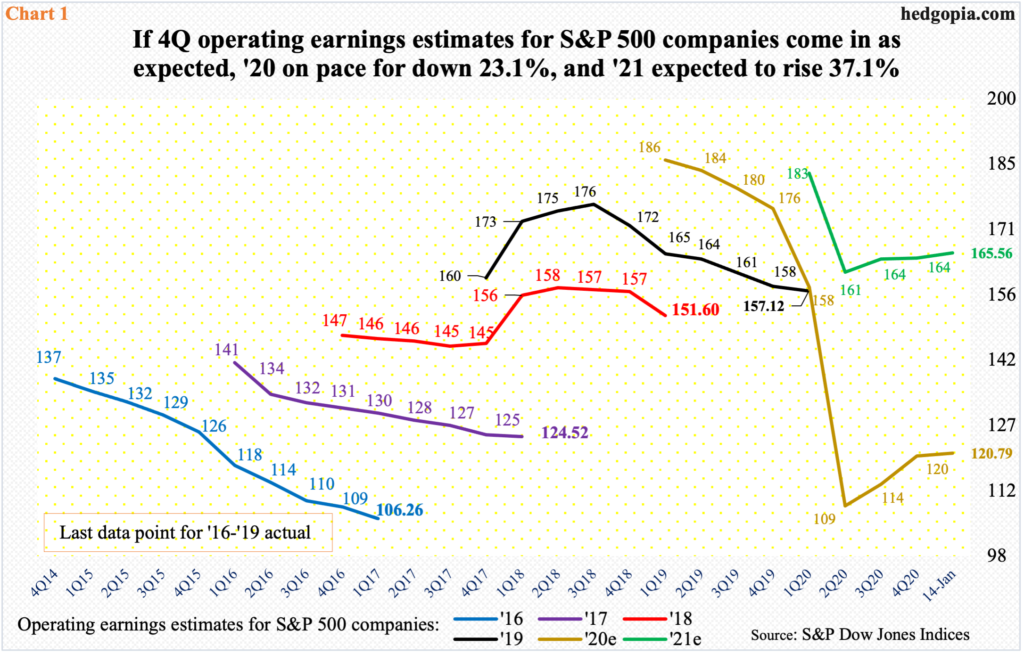
Just before companies began publishing their reports, the sell-side showed conviction by raising numbers in the first two weeks of January. Fourth-quarter operating earnings estimates for S&P 500 companies were $36.05 at the end of last year and were revised higher to $36.60 as of the 14th this month. If earnings come in as expected, these companies are on course to ringing up $120.79 in 2020, down from $157.12 in 2019. Expectations have massively built up for this year, with consensus at $165.56 (Chart 1).
From stocks’ perspective, what is more important is what kind of reaction these results elicit from investors. On this score, the 4Q reporting season has been a disappointment so far.
On January 15, JP Morgan (JPM), Wells Fargo (WFC) and Citibank (C) reported. They all sold off and continued lower last week. On the 19th, Goldman Sachs (GS) and Bank of America (BAC) reported and sold off. On the 20th, Morgan Stanley (MS) reported and rallied intraday to a new high but only to reverse and close down.
Similar adverse reaction was noticed last Friday when Intel (INTC) and IBM (IBM) each dropped north of nine percent in reaction to Thursday’s earnings. Of the majors, Netflix (NFLX) bucked the trend on Wednesday gapping up nearly 17 percent.
Leading up to this, stocks rallied massively. It is entirely possible the post-earnings reaction is nothing but normal profit-taking.
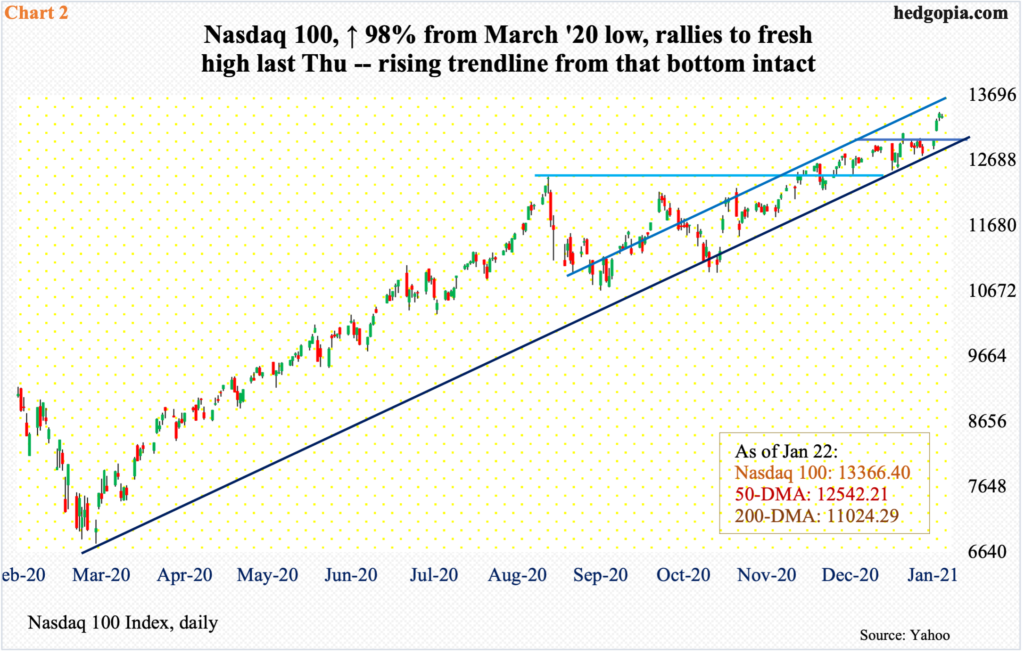
For instance, from the lows of last March through last Thursday’s new intraday all-time high of 13433.69, the Nasdaq 100 shot up 98 percent. That is in 10 months!
But support levels continue to generate buying interest, including a rising trend line from that low (Chart 2). Early this month, bids showed up at that level, which approximated horizontal support at 12430s, which goes back to September 2.
Immediately ahead, there is short-term support at 13000. In the right circumstances, the index (13366.40) can push toward the upper range of the short-term channel it is in. For that to happen, investors’ reaction function this week and next is key.
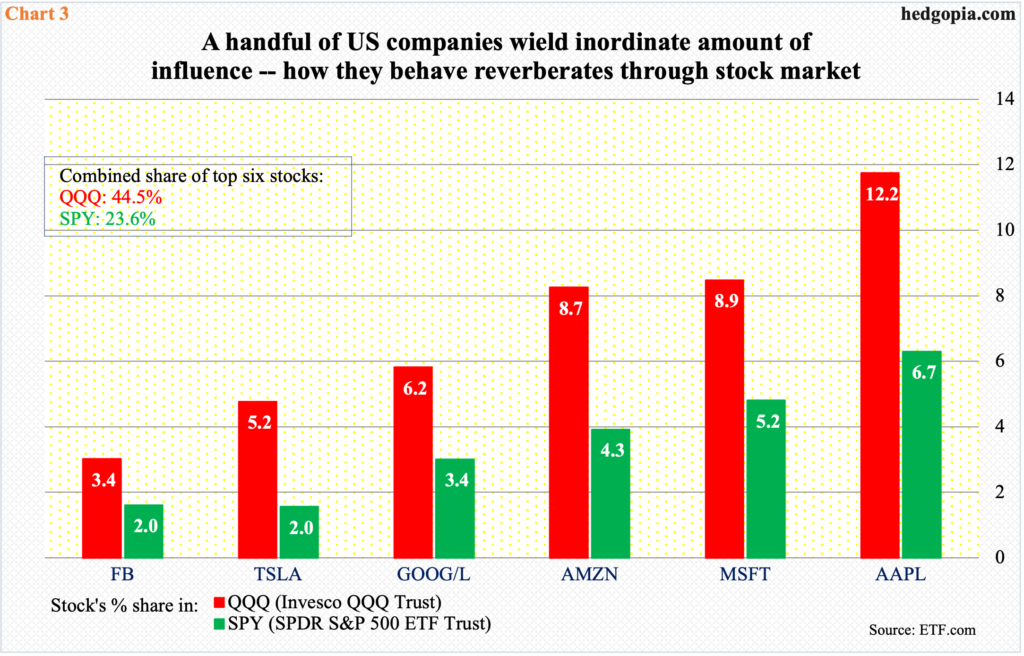
Of the top six US companies, Microsoft (MSFT) reports on Tuesday, Apple (AAPL), Tesla (TSLA) and Facebook (FB) on Wednesday, and Amazon (AMZN) and Alphabet (GOOG) on Tuesday next week. These are the heavy hitters not only within tech but the entire stock market (Chart 3). Combined, they account for 23.6 percent of SPY (S&P 500 ETF) and 44.5 percent of QQQ (Invesco QQQ Trust).
How they act, and how markets react to their earnings, can reverberate through major equity indices. Bulls obviously do not want a repeat of the kind of reaction handed out to INTC and IBM last Friday.
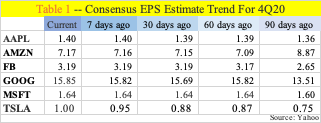
The thing is, the 4Q revision trend for all these six companies have been higher over the last sixty days. As a matter of fact, except for AMZN, consensus estimates have trended higher over at least the last 90 days (Table 1).
This is more or less in line with how the overall revision trend evolved for S&P 500 companies. Estimates for both this year and last bottomed last July at $160.89 and $108.86 respectively (Chart 1). The only thing is that there is now a flattish look to it, particularly this year’s, which is obviously where markets are focused on. If estimates come through, earnings would have jumped 37.1 percent this year.
The question is if this is in the price.
Once again, stocks have had a phenomenal run since last March. The temptation to lock in gains is natural. In whatever selling pressure that has transpired, sellers in due course have been outnumbered by buyers, who continue to defend support, both short- and long-term.
Bull markets survive as long as there is someone – a greater fool – willing to pay a higher price. As soon as the Greater Fool Theory breaks down, speculative bubbles burst. But before that happens, there is money to be made, which is what drives bullish sentiment.
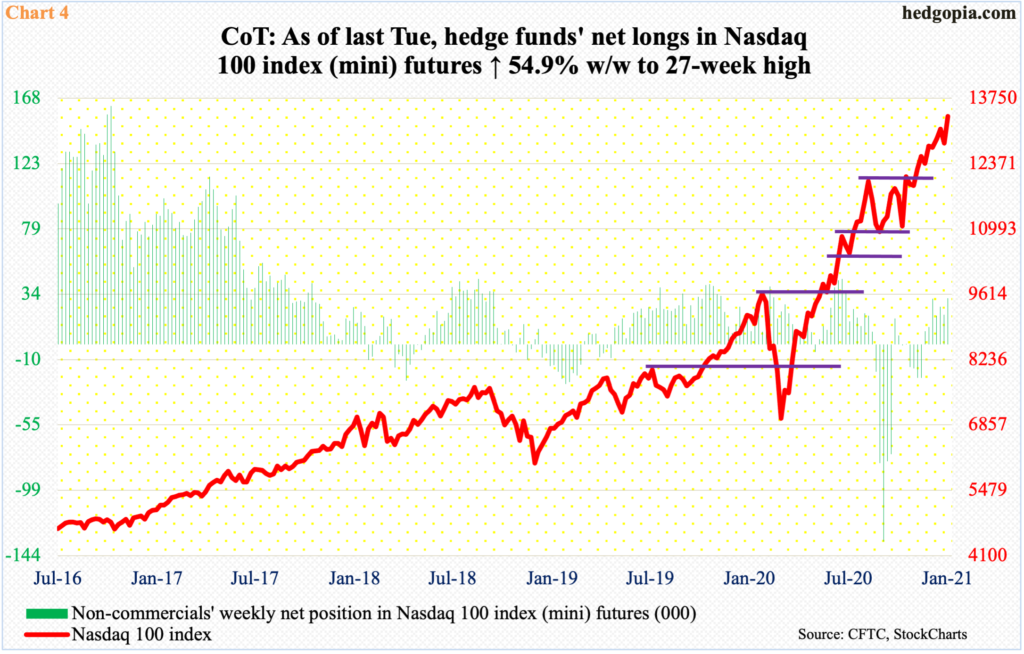
Ahead of December-quarter earnings from major tech outfits this week and next, non-commercials meaningfully raised net longs in Nasdaq 100 index (mini) futures. As of last Tuesday, they held 31,611 contracts, up 54.9 percent week-over-week to a 27-week high (Chart 4).
Concurrently, there has been a massive increase in willingness to take on leverage.
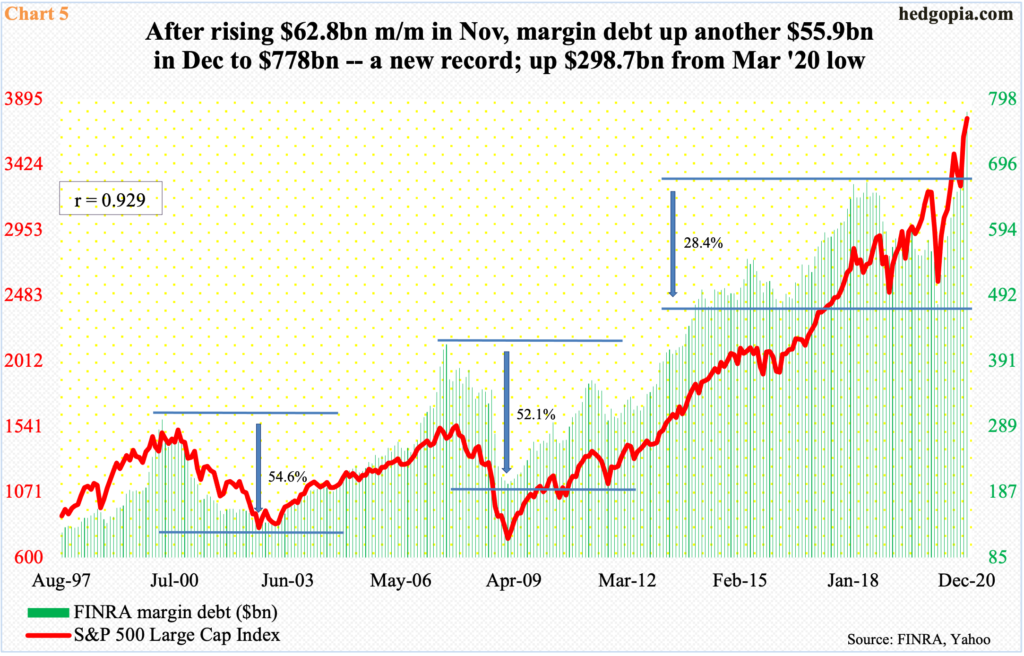
In December, FINRA margin debt jumped $55.9 billion month-over-month to $778 billion – a fresh record. This came on the heels of a $62.8-billlion m/m surge in November. In those two months, the S&P 500 Large Cap Index shot up 14.9 percent, and the Nasdaq 100 16.6 percent. With five sessions to go this month, they have rallied 2.3 percent and 3.7 percent respectively.
As Chart 5 shows, the correlation between margin debt and the S&P 500 is tight – coefficient of 0.929 in the case of the S&P 500 going back to January 1997 and 0.873 vis a vis the Nasdaq 100 (the latter not shown here).
The chart also shows that margin debt cuts both ways. It helps on the way up as much as it hurts on the way down. Once trades begin to go the other way, margin calls can be costly, setting in motion a vicious cycle. The tipping point never comes with a warning. With that said, truth be told, it has paid off to lever up – so far. As long as they have an exit strategy, traders with the proper skill set can ride this crazy wave profitably.
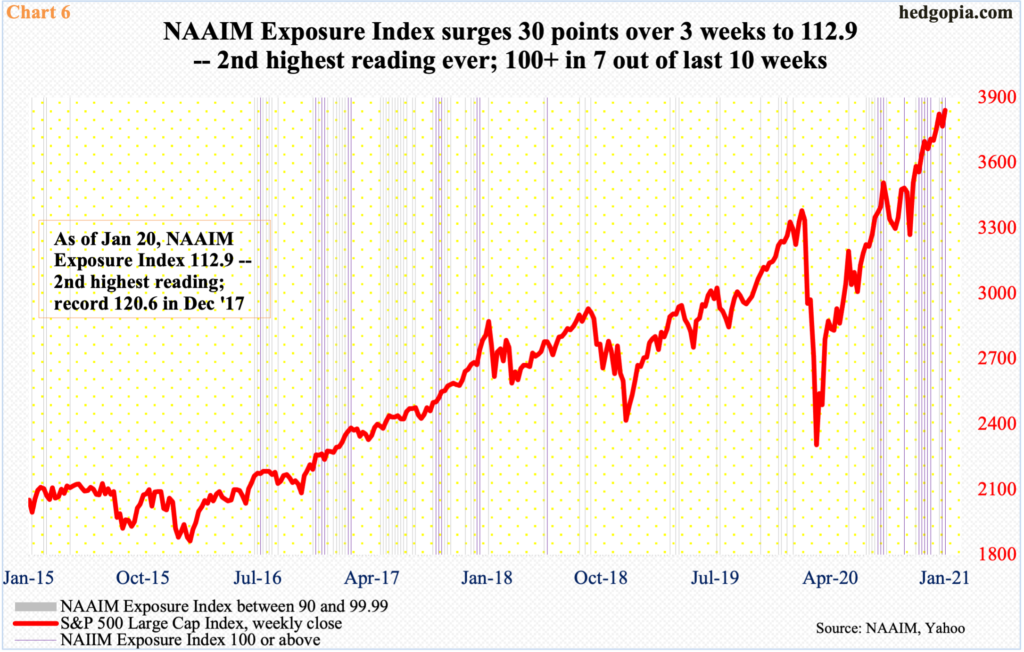
Professional money managers are all in. At least going by the NAAIM Exposure Index, which measures National Association of Active Investment Managers members’ average exposure to US stocks, optimism is at a very high level – nearly lopsidedly bullish.
With three weeks in, the index is up 30 points in January to 112.9, which is only the second highest reading after 120.6 recorded in December 2017. Going back to July 2006 – encompassing 760 weeks – there have been 27 100-plus readings, seven of which occurred since mid-November, or 11 since mid-August. That is how persistently elevated this metric has been (Chart 6).
This is similar to how Investors Intelligence bulls have remained north of 60 percent in nine weeks in a row. Historically, it has proven difficult to sustain above 60 percent, although between October 2017 and January 2018 it stretched to 17 consecutive weeks (more on this here).
This time around, giving bulls credit where it is due, it has paid off to remain bullish. But as in any other bullish runs in the past, this one will end. It is a matter of when not if. Hence the significance of investor reaction to the six tech companies mentioned above.
Thanks for reading!
