There are some interesting dynamics taking place in the U.S. jobs market.
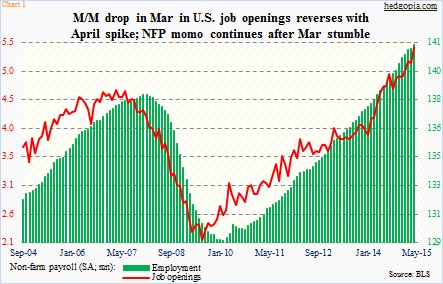
The JOLTS report for April was released this morning. Turns out the March drop in non-farm job openings was an aberration. March openings were still down from 5.14 million in February but were revised higher from 4.99 million to 5.11 million. April shot up to 5.38 million (Chart 1). This series tends to go hand in hand with non-farm payroll numbers, so this should bode well. We already saw an addition of 280,000 non-farm jobs in May.
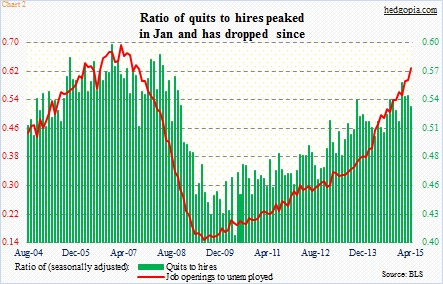
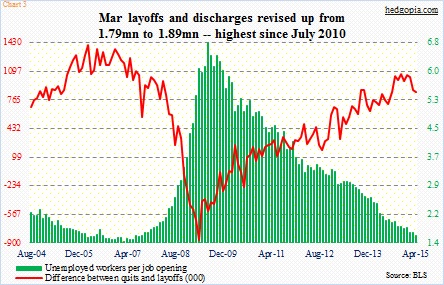
As a result of the spike in job openings in April, the ratio of job openings to unemployed jumped to 0.63, a cycle high (Chart 2). The all-time high was reached in March 2007 at 0.69. The green bars in Chart 3 show the same thing. There are fewer and fewer unemployed workers per job opening.
This is all good.
Now on to something not so encouraging.
The ratio of quits to hires peaked in January at 0.56 and has since dropped, to 0.53 in April (Chart 2). Ideally, in a healthy market, people quit because they either have lined up something or are confident about jobs prospects. Quits peaked in January at 2.78 million, but were holding their own. In April, however, they tumbled 100,000 to 2.67 million.
In the meantime, hires peaked at 5.24 million in December, dropping to five million by April. Another way of looking at this subtle deterioration is shown by the red line in Chart 3. The difference between quits and layoffs has peaked and is pointing lower. March layoffs and discharges were revised higher from 1.79 million to 1.89 million – the highest since July 2010.
The bottom line is this. The JOLTS report looks great if we just focus on job openings, but elsewhere things are diverging a little bit. The question is if this is an aberration or the beginning of a trend.
Fingers crossed.
Thanks for reading!

