
Tech is overbought but remains in an uptrend. Wednesday, bears showed up as soon as the Nasdaq 100 kissed the upper end of a rising channel, but bulls are hanging tough. What happens here will have ramifications for other indices, including the S&P 500, which in the right circumstances can rally another 2.5 percent.
Tech has been simply going gangbusters this year. The Nasdaq Composite year-to-date is up 25.2 percent and the more-concentrated Nasdaq 100 is up 32 percent. Within this, the top five US stocks are all tech, and this has obviously helped several other market cap-weighted indices.
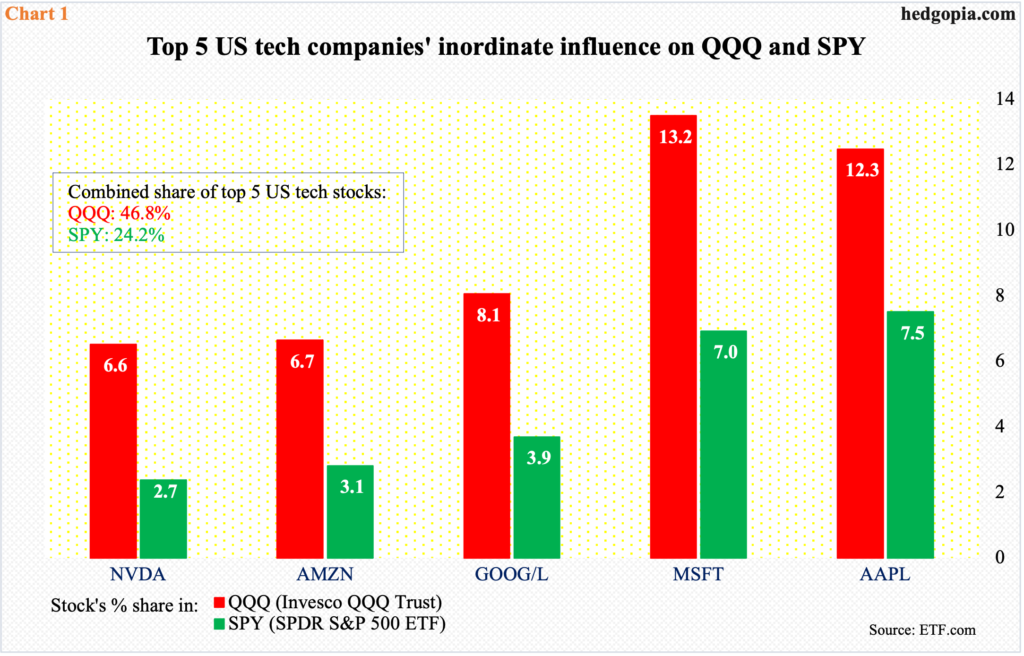
In QQQ (Invesco QQQ Trust), Microsoft (MSFT), Apple (AAPL), Alphabet (GOOG/L), Amazon (AMZN) and Nvidia (NVDA) combined account for 46.8 percent; in SPY (SPDR S&P 500 ETF), this is 24.2 percent (Chart 1).
It will not be an exaggeration to say that as go these five, so go the Nasdaq 100 and the S&P 500, not to mention several other equity indices.
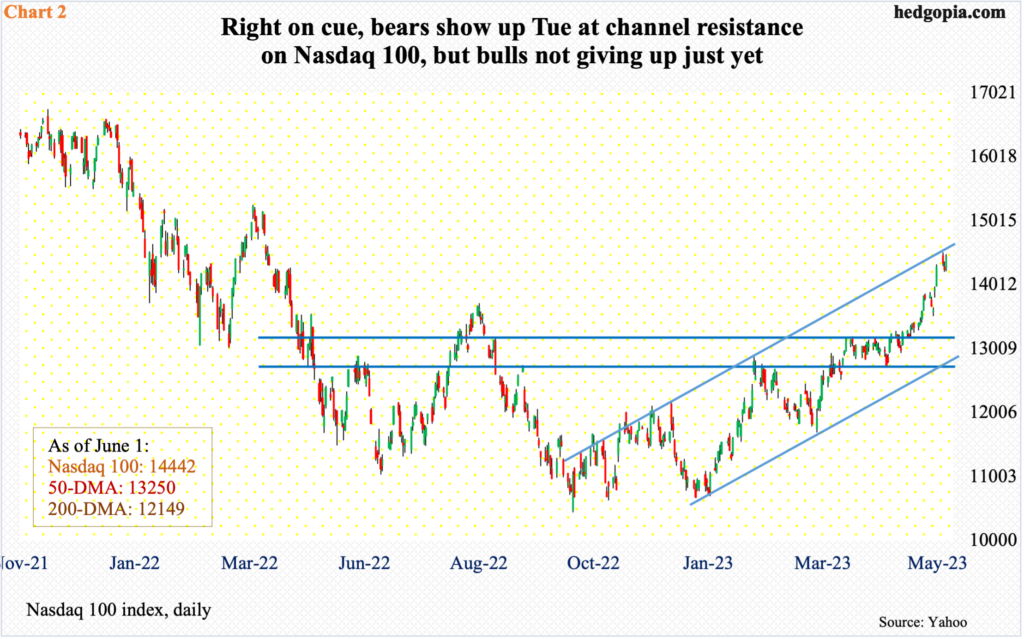
In 2022, the Nasdaq 100 tumbled 33 percent. With five months in, the index is close to erasing that loss this year. Momentum is strong – has been since early this year, even though the index bottomed last October.
The takeout of 13100s, which resisted rally attempts for four weeks before the index poked its head out five weeks ago, has been a mini milestone as far as tech bulls are concerned. Last week, the index shot up 3.6 percent, which was preceded by a 3.5 percent jump in the week before. This week, with one session to go, it is up one percent.
Of note, the Nasdaq 100 has traded within an ascending channel since January, the upper end of which was tested this Tuesday as the index tagged 14520; sellers immediately showed up, closing the session at 14355. Thursday, bulls once again went after it, ticking 14493 intraday and closing at 14442 (Chart 2).
This is a spot where a decent bull-bear duel is probable, and what happens here can reverberate through a lot of other indices, not the least of which is the S&P 500.
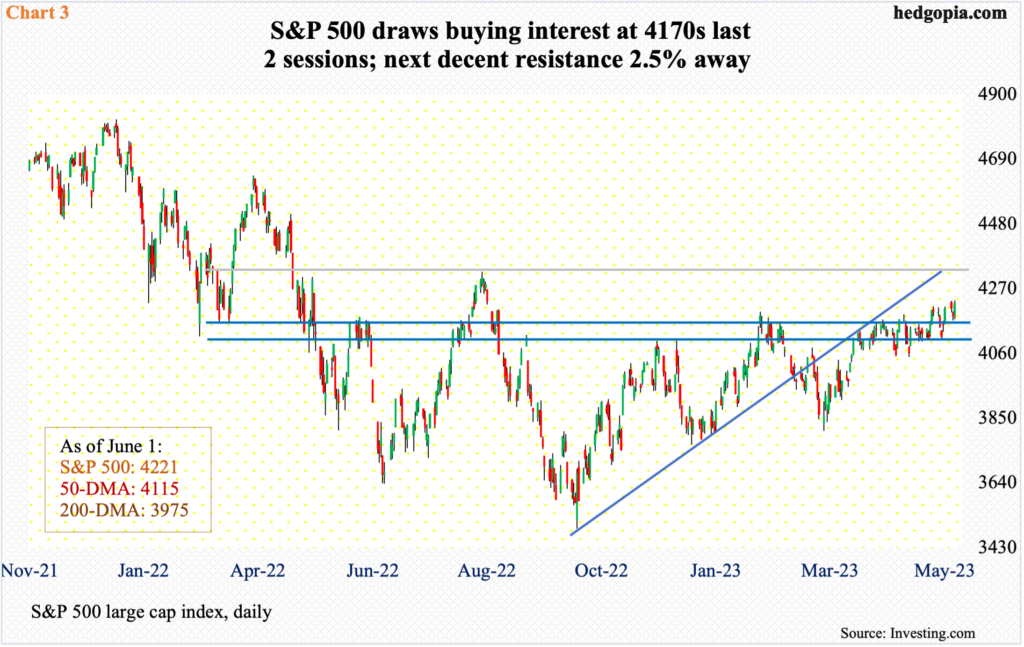
Encouragingly for the large cap index, the last couple of sessions saw the bulls put their foot down at 4170s, which the S&P 500 broke out of two weeks ago. Before that, 4100 was taken care of mid-April (Chart 3).
In the right circumstances for the bulls, the index has a shot at 4320s, which both represent last August’s high and the underside of the broken rising trendline from last October’s bottom. This is 2.5 percent away. Hence the significance of how the Nasdaq 100 acts at the above-mentioned channel resistance and how the leading five tech outfits behave.
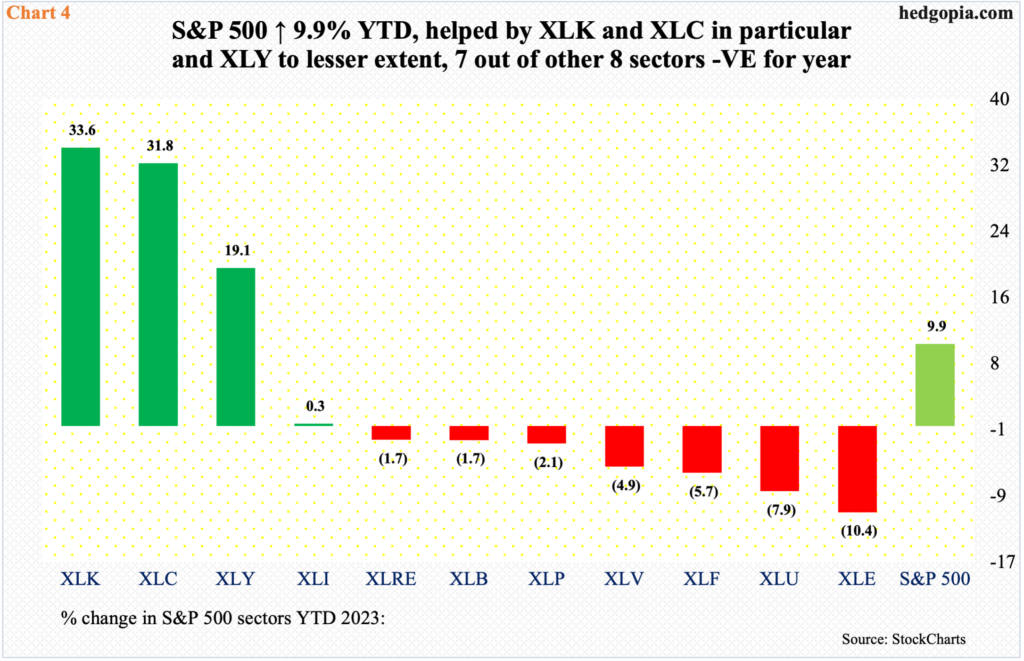
The S&P 500 is up 9.9 percent year-to-date. Not surprisingly, tech is the largest contributor. Of the 11 constituent sectors, three – XLK (technology), XLC (communications services) and XLY (consumer discretionary) – are up huge, even as XLI (industrials) is up a tiny 0.3 percent. The remaining seven sectors are all down, including XLB (materials), XLF (financials) and XLE (energy).
XLK, XLY and XLB are considered offensive sectors – kind of a risk-on – but the latter is yet to join the first two. The other side of the coin is represented by XLP (consumer staples), XLU (utilities) and XLV (healthcare), which represent the defensives. They are all down so far this year. So, investors have not all gravitated to risk-off just yet. This should give the bulls hope. They now need the Nasdaq 100 to cooperate.
Thanks for reading!
