Another down week for gold – fifth in a row! Last Friday’s action in the meantime points to potential relief ahead – at least near-term.
At one point when the metal made a weekly low on Friday, it was down five-plus percent. But a reversal later that session ended the week down three percent.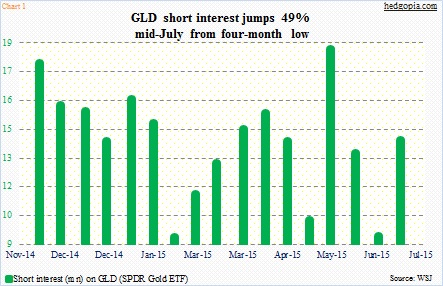
Short interest probably played a role in all this. During the June 30th-July 15th period, GLD, the SPDR Gold ETF, fell two percent. Short interest jumped 49 percent during the period (Chart 1). It remains well below the end-May level, but the recent spike probably points to shorts’ rising conviction.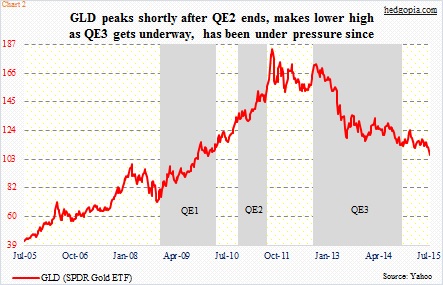
Sentiment is out-and-out bearish, and it is not some recent phenomenon. Gold peaked a long time ago – in fact shortly after U.S. QE2 ended. That development in and of itself was not a shocker. It became one when the metal failed to rally to new highs as QE3 got underway (Chart 2). Since then, there have been counter-trend rallies, but the primary trend has been downward.
Most recently, after losing $114-plus last October, GLD proceeded to lose $110 six sessions ago. Volume has spiked as the latter support got taken out. It is too soon to say if the recent action is a washout, but gold bugs have reason to be hopeful – at least near-term.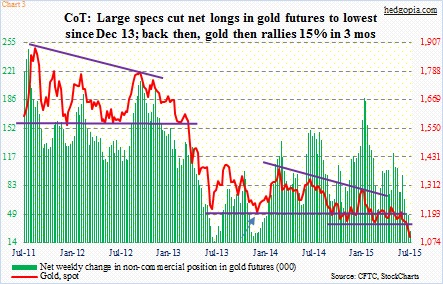
1. Last week, non-commercials continued to reduce net longs in gold futures, to just north of 28,000 contracts. Holdings are the lowest since December 2013. These traders have cut back 85 percent since end-January and 77 percent since mid-May.
In Chart 3, the red line has tended to follow the green bars closely. It is possible non-commercials have cut enough. Back in December 2013, they cut all the way down to just under 23,000 before rebuilding positions. Gold then proceeded to rally 15 percent in three months (arrow in Chart 3).
2. Of course, each cycle is different. How things transpired back then does not mean they will evolve similarly this time around. Nonetheless, the price action in gold on Friday is an indication that big money is beginning to take an interest.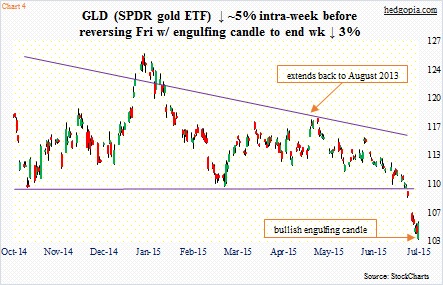
As stated earlier, Friday saw a huge reversal. The bullish engulfing candle on GLD is probably a sign that the metal attracted institutional money that day (Chart 4). (Spot gold shows a hammer candle.) In and of itself, this is a signal that the bulls have taken control from the bears. The question is of duration and sustainability. This week’s price action has now taken on added importance.
3. Between April 2001 and September 2011, gold surged north of seven times. Viewed from this perspective, the digestion that has gone on the past four years is nothing out of the ordinary. The question is, how much of that move will be retraced before another leg higher begins.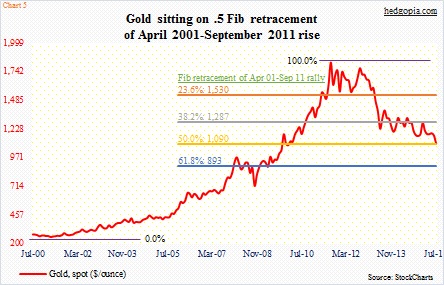
Chart 5 shows various retracement levels of the decade-long rally that preceded the current downturn. Gold ($1,098.4) currently sits right on 50-percent retracement. More often than not, it is common for an asset class – after a huge move – to retrace 61.8 percent. Should that happen, gold has a long way to go on the downside. But even if that were the case, the metal currently is positioned well to stage a counter-trend rally.
There are tons of oversold conditions waiting to get unwound on a weekly basis. Not to mention severely oversold daily conditions.
The hypothetical trade on GLD ($105.35) is currently sitting with a loss. To refresh, July 17th 111 puts were sold for $0.60 on July 7, resulting in effective long at $110.40. This was followed by a July 24th covered call for $0.37. As a result, it is now an effective long at $110.03.
The Friday action in encouraging.
As things stand now, if GLD manages to rally back to $110, shorts/sellers are likely to appear around that level. It is hard to imagine the ETF rallying through that resistance this week. Weekly July 31st 110 calls fetch $0.10. It is not much, but every little bit helps. If these calls get exercised, then the position is closed for a profit of $0.07. Else, the cost drops to $109.93.
Thanks for reading!

