In the wake of the tax cuts of December 2017, S&P 500 companies are paying less than 20 percent in income taxes. All good except the gap between GAAP and non-GAAP income remains.
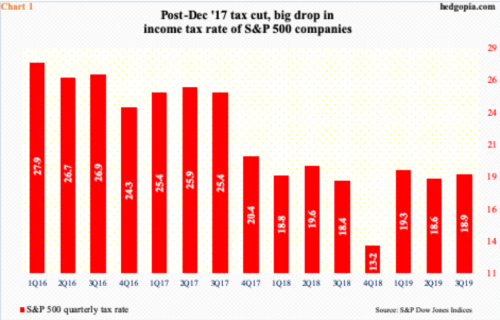
In 3Q19, S&P 500 companies paid 18.9 percent in income taxes. This was slightly up from 18.6 percent sequentially but down big historically. Between 1Q93 and 3Q19, S&P Dow Jones Indices points out that the average tax rate was 31.4 percent.
The tax rate meaningfully dropped in the wake of the tax cuts of two years ago. The Tax Cuts and Jobs Act of 2017 was signed into law in December that year. In 3Q17, the tax rate was 25.4 percent, before dropping to high teens in subsequent quarters (Chart 1).
Annually, the rate in 2017 was 24.4 percent, which then dropped to 17.7 percent in 2018. In the first three quarters of 2019, this averaged 18.9 percent; results for the fourth quarter are being reported.
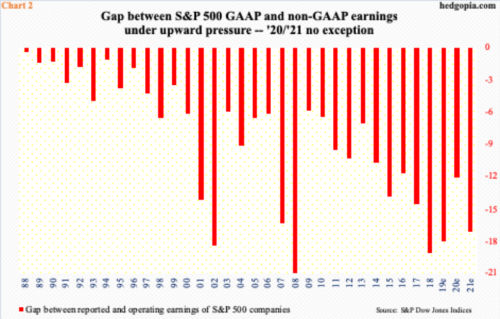
This is all well and good but is yet to positively impact something that has plagued US corporate earnings for a while now. The gap between GAAP (reported) and non-GAAP (operating) has gradually risen for 30 years now (Chart 2). Non-GAAP is pre-tax operating income, GAAP is after tax.
On balance, the lesser the discrepancy between the two the higher the quality of earnings. In the current cycle, the gap between the two bottomed in 2009 before widening. The cycle high was reached in 2018 when the gap stood at $19.21 – $151.60 operating and $132.39 reported – with growth rate of 21.8 percent and 20.5 percent respectively. This year, the sell-side forecasts the gap to shrink to $12.15 but only to once again expand to $17.20 next year.
The 2017 tax cuts helped improve the bottom line but not the quality of earnings – at least not yet.
Thanks for reading!

