
After 11 consecutive months of remaining sub-parity, the green line in Chart 1 went back over in July. The line represents a ratio of NYSE margin debt to its 12-month average. When the latter is higher than the former, it signifies decelerating momentum, and vice versa. The July development is potential bullish for equities. But is it a signal or noise?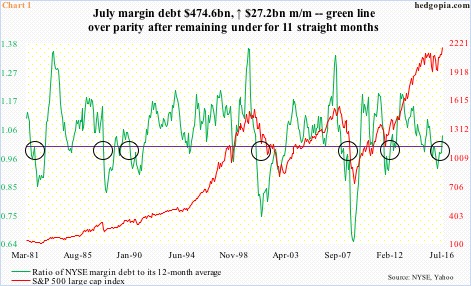
Margin debt peaked at $507.2 billion in April last year; the S&P 500 large cap index peaked a month later. After dropping to $435.8 billion in February this year, it has been rising. July was up $27.2 billion month-over-month to $474.6 billion – the highest since July last year. The S&P 500 rallied 3.6 percent in July.
U.S. indices made an important bottom early February this year. Margin debt, too, began to rise after making a 27-month low that month (Chart 2).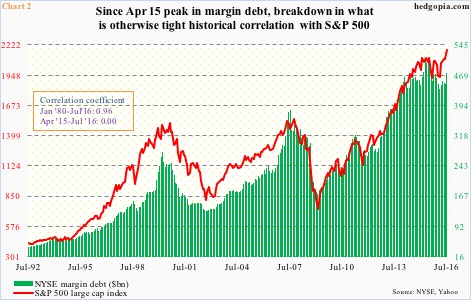
Historically, there is a tight correlation between margin debt and the S&P 500. From January 1980 to July this year, correlation coefficient between the two is near-perfect 0.96. From April last year, however, correlation has broken down to zero (Chart 2).
Hence the difficulty in deciding if the green line in Chart 1 should be treated as a signal or noise.
Most recently, it dipped below parity in August last year. The S&P 500 closed at 1972.18 in that month, but intra-day dropped as low as 1867.01. Later in February this year, that low was undercut as the S&P 500 declined to 1810.10. That was the extent of decline post-signal in Chart 1. The green line stayed below parity for 11 straight months. Versus prior signals, the drop to 1810 was much softer. Particularly in 2000/2001 and 2007/2008, it had a much sharper drop. This time around, it reversed quicker – much like in 2011.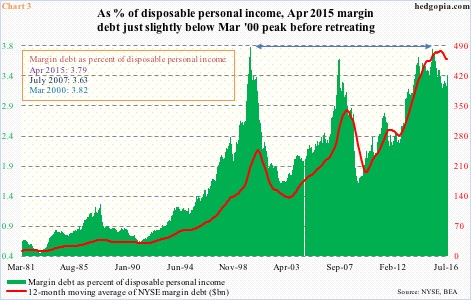
Here is the difference between 2011 and now. Throughout that year, the most the green bars in Chart 3 could rise to was 2.74 (in April). Now, the bars are much higher. July was 3.38, and peaked at 3.79 in April last year. These bars represent percent of margin debt in disposable personal income. The higher the number, the riskier it is.
That April 2015 high in Chart 3 was the second highest after 3.82 in March 2000. Stocks concurrently peaked in 2000. This time around, the S&P 500 did peak in May last year, but has gone on to surpass that high. Margin debt has not. The July increase is encouraging for the bullish camp, but in the aggregate traders still act hesitant.
It is this divergence that makes it hard to treat the green line in Chart 1 as a clean signal. The message is blurred.
Thanks for reading!
