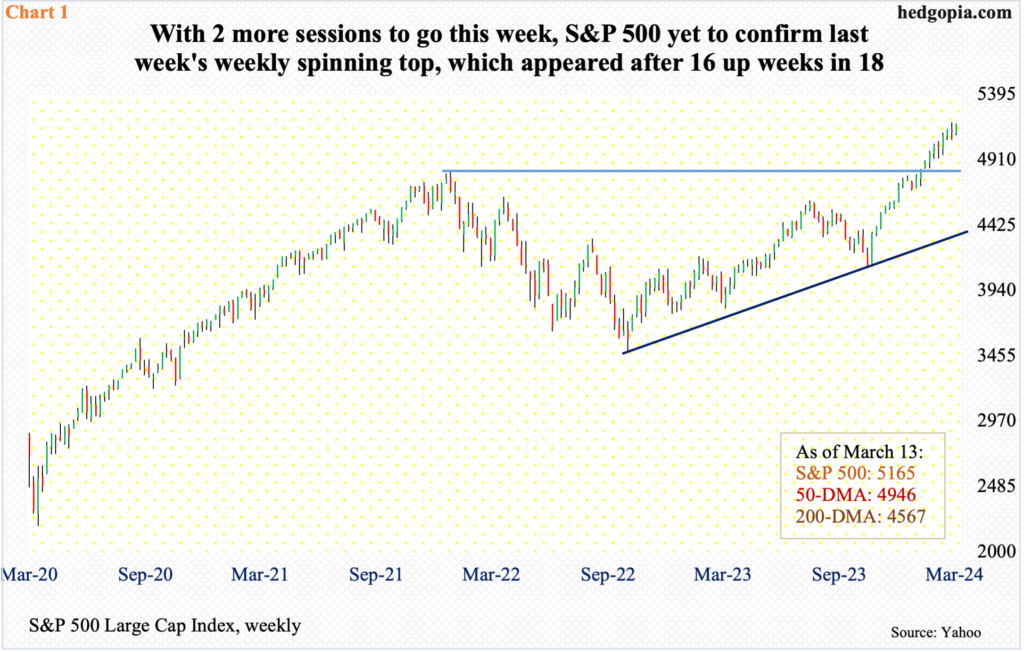
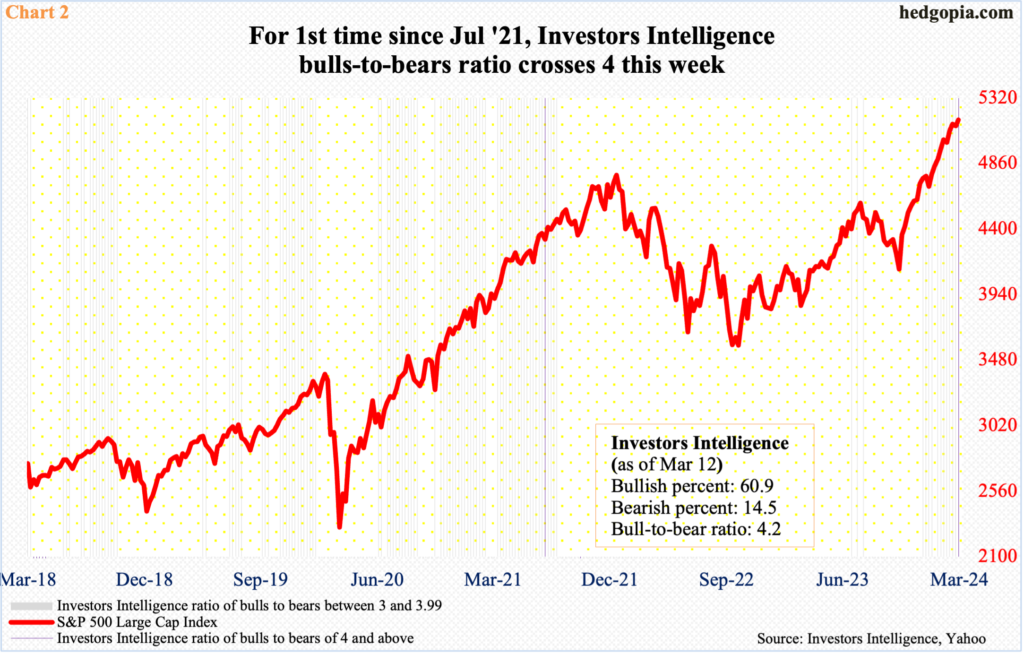
With two more sessions to go this week, last week’s potentially bearish candle is not yet confirmed on the S&P 500. Concurrently, the bullish view continues to gather momentum as the ratio of Investors Intelligence bulls to bears crossed four this week.

Last week, the S&P 500 formed a weekly spinning top. The week slightly ended lower, and this was the third down week in 19. The large cap index has rallied relentlessly since bottoming last October, having jumped 26.5 percent through last Friday’s intraday high of 5189.
The index remains overbought on nearly all timeframes.
Amidst this, the appearance of a weekly candle showing indecision combined with Friday’s intraday reversal could have opened the doors for the bears. They tried this Monday, but the weakness was bought, coupled with Tuesday’s big rally, even though February’s consumer price index out that morning was hotter than expected. With three sessions in, the S&P 500 is up another 0.8 percent to 5165 – a fresh closing high, although last Friday’s intraday high remains intact (Chart 1).

As the bears struggle to make a dent in the bullish momentum, their count is getting smaller by the day. In the week to Tuesday, Investors Intelligence bearish percent dropped 1.5 percentage points week-over-week to 14.5 percent – the lowest since February 2018; bulls were 60.9 percent, which was the highest since July 2021.
As a result, the ratio of bulls to bears crossed four – 4.2, to be specific. This does not happen that often. The last time the ratio hit four was in July 2021. Leading up to this, the ratio stayed between three and four in 11 of 12 weeks (Chart 2).
The appearance of a four – or, for that matter, bulls north of 60 percent or bears south of 15 percent – in and of itself does not mean the end is near. As a matter of fact, it can be argued the rally has been built on a consistently rising number of bulls. But it – the four reading – does point to the prevailing frenzy. If not outright a red flag, this has to be at least a yellow.
Thanks for reading!

