
Crude oil made the headlines big last week – in an adverse manner. Not that it has not been in the headlines. But last week was different in that it entered a bear market, which supposedly happens when an asset drops 20 percent.
From $55.24 on January 3 this year to $42.05 on June 21, spot West Texas Intermediate crude shed nearly 24 percent. Spot Brent crude dropped from $58.37 to $44.35 during the period, for a similar drop.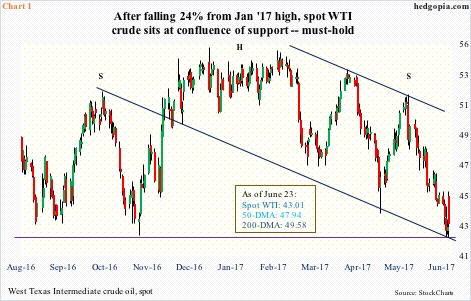
With this, oil sits at a critical juncture.
Support at the $42-plus level on spot WTI goes back more than two years. This also makes up the neckline of a potentially bearish head-and-shoulders formation. Oil has also been trading within a channel from last October, the low end of which was tested last week (Chart 1).
The point is, there is a confluence of support where WTI sits today. The daily chart is grossly oversold. At least going by Thursday and Friday last week, one gets the impression that it is attempting to stabilize.
Should a rally ensue, what transpires around $45 will be a big tell.
On November 29 last year, WTI closed at $45.23. The next day, OPEC and non-OPEC nations such as Russia hammered out a deal to cut crude production by 1.8 million barrels per day. This lit a fire under oil into the afore-mentioned January peak this year. The six-month agreement was extended last month by another nine months until next March, but this coincided with the most recent peak in the price.
In fact, for the past eight sessions, WTI has traded under the pre-OPEC-agreement price from November last year.
Supply continues to be a thorn in oil bulls’ side.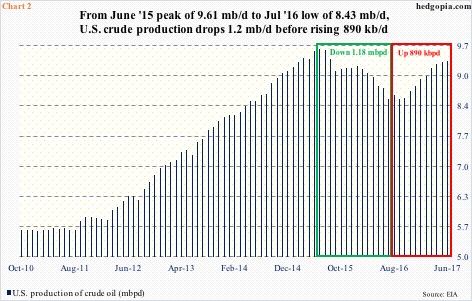
When OPEC reached the agreement, Libya and Nigeria were exempted from the cuts. Nigeria just pumped 1.68 mb/d – a one-plus-year high – even as Libya’s 900,000 b/d was the most in four years.
Then there is U.S. shale.
After a parabolic rise lasting more than three years, U.S. crude production peaked at 9.61 mb/d in June 2015. That high is yet to be surpassed. But at the latest 9.35 mb/d, it is not that far away. Production has gone up nearly 900,000 b/d from last July’s low (red box in Chart 2). Importantly, since the OPEC agreement last November, it is up 651,000 b/d – by more than a third of the OPEC cut.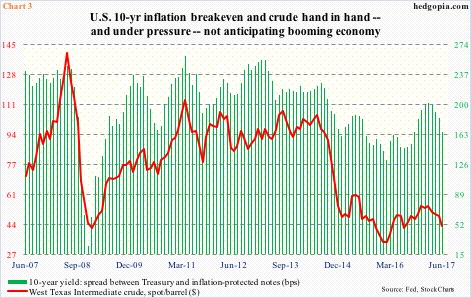
But is the culprit just supply?
Chart 3 pits spot WTI with a yield difference between 10-year Treasury and inflation-protected securities. Directionally, the two follow each other. Most recently, the spread peaked at 202 basis points in February this year, closing last week at 162 basis points.
The narrowing spread does not reflect a booming economy with upward pricing pressure and rising inflation expectations.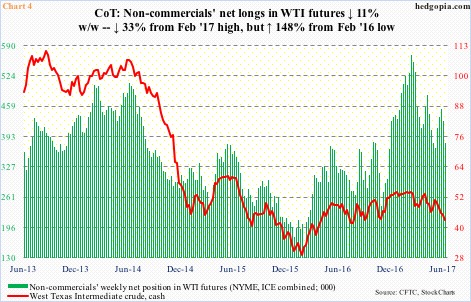
Here is the thing.
Yes, crude price has taken a big hit, but at least going by how non-commercials are positioned, sentiment is holding up.
As of last Tuesday, these traders were net long 379,517 contracts in WTI futures (Chart 4). This is down from 569,710 in February this year. One year prior to that, their holdings dropped to 152,814 coinciding with a bottom in the spot at $26.05 in February last year – as well as in U.S. stocks in general.
The suggestion here is not that a bottom in oil will not be at hand until these traders throw up their hands in the air and yell ‘get me out.’ That said, risk rises if spot WTI loses the afore-mentioned support at $42-plus, or a rally aggressively gets sold/shorted at $45-plus.
Thanks for reading! Please share.
